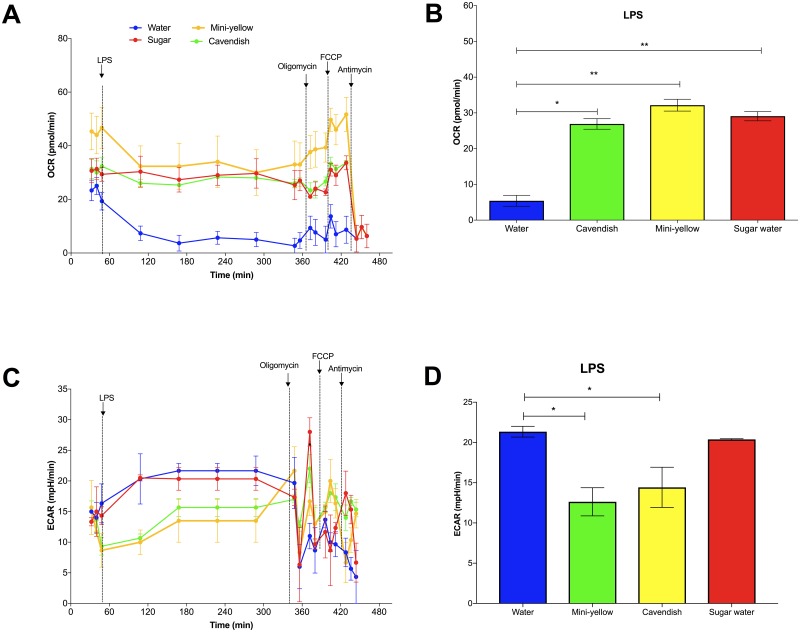
Fig 10.
A) Changes in oxygen consumption rate (OCR) (basal state, after LPS stimulation, after injection of mitochondrial complex inhibitors) in THP1 monocytes immediately post 75-km cycling across four treatments (water only, Cavendish and mini-yellow bananas, and 6% sugar beverage) in cyclists. The bar chart (B) summarizes the LPS phase for OCR. C) Changes in extracellular acidification rate (ECAR) (basal state, after LPS stimulation, after injection of mitochondrial complex inhibitors) in THP1 monocytes immediately post 75-km cycling across four treatments (water only, Cavendish and mini-yellow bananas, and 6% sugar beverage) in cyclists. The bar chart (D) summarizes the LPS phase for ECAR. Data are mean ± SE. * Significantly different from the water-only trial, P≤0.05, respectively.

