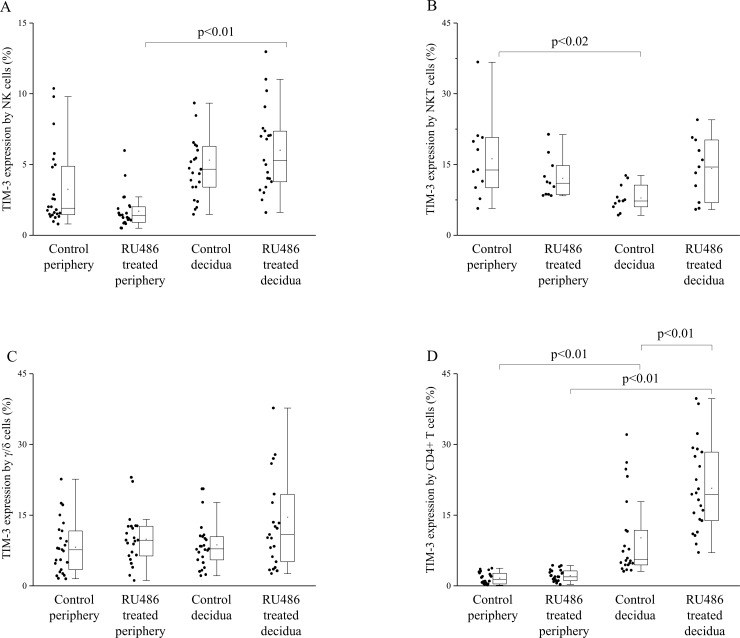
Fig 4. TIM-3 expression by decidual and peripheral mononuclear cells from untreated control and RU486 treated pregnant mice.
Box plot of the median, the 25th and 75th percentiles, range, and individual data values for the expression of TIM-3 by NK cells, NKT cells, γ/δT and CD4 T cells in periphery and decidua in untreated and RU486 treated pregnant mice. The middle line within the box represents the median, the middle dot within the box represents the mean, the boxes indicate the interquartile ranges and the whiskers show the most extreme observations. Differences were considered statistically significant for p-values ≤0.05.

