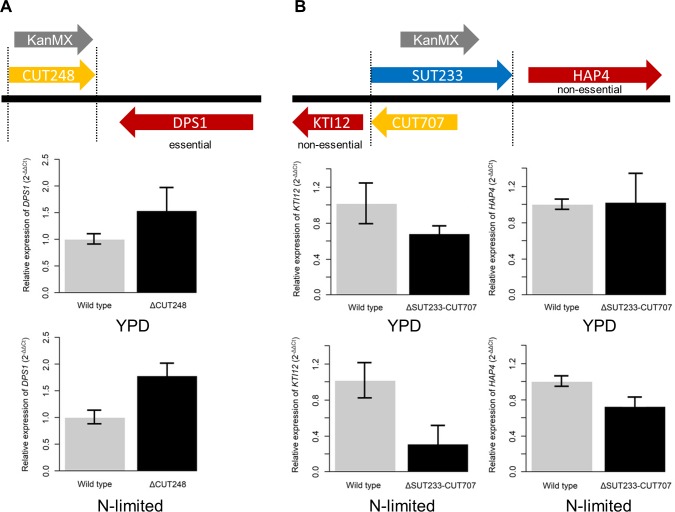
Fig 2. Genome location of ncRNA deletions and RT-PCR quantitation of mRNA levels.
(A) Genome location of CUT248 compared to DPS1. All of CUT248 was deleted. Relative expression of DPS1 in the wild type diploid background is represented by grey bars and DPS1 expression in the CUT248 diploid heterozygous deletion background is represented by black bars. Cells were grown in either rich media (YPD) or N-limited conditions. DPS1: YPD p = 0.006, N-limited p = <0.01. (B) Genome location of SUT233/CUT707 between the HAP4 and KTI12 genes. Relative expression of HAP4 or KTI12 in the wild type diploid background is represented by grey bars and HAP4 or KTI12 expression in the SUT233/CUT707 diploid heterozygous deletion background is represented by black bars. Cells were grown in either rich media (YPD) or N-limited conditions. HAP4: YPD p = 0.97, N-limited p = <0.01. KTI12: YPD p = 0.05, N-limited p = <0.01. The fold change (2^) in expression, relative to the wild-type was calculated using the ΔΔCт method and ACT1 as a reference gene. Error bars were calculated using three independent biological samples. P values were calculated using the Welch two sample t-test.

