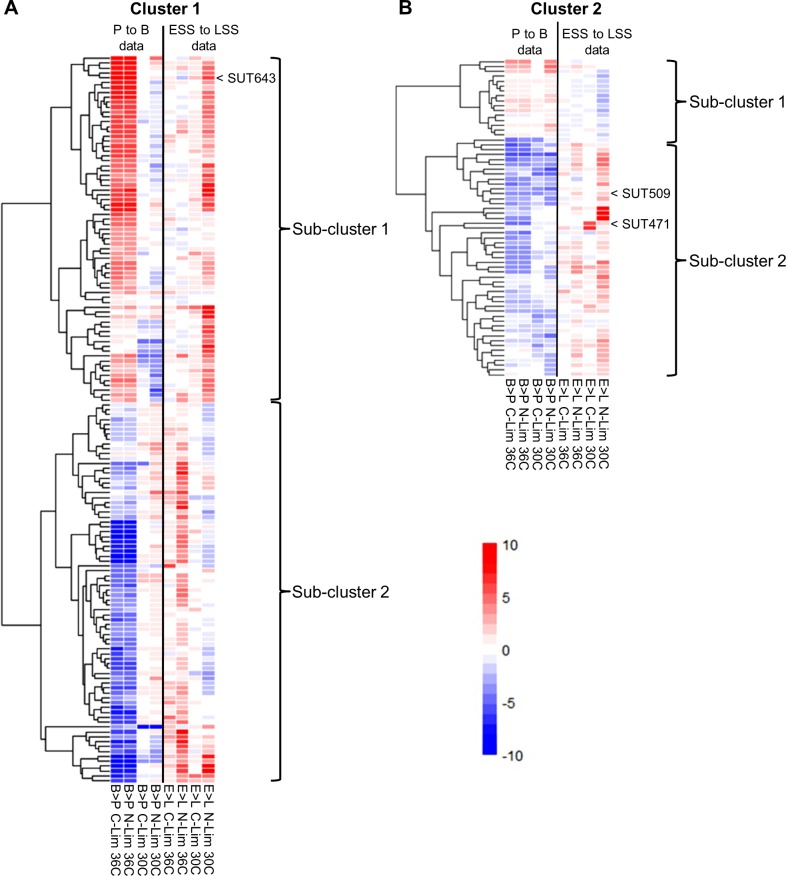
Fig 4. Co-fitness analysis.
Variation of fitness profiles in Cluster 1 (A) and Cluster 2 (B). Rows represent individual ncRNA deletion strains. Columns represent the eight growth conditions analysed (B>P: comparison between batch and pool; L>E: comparison between late and early steady state; C-Lim: carbon-limited medium; N-Lim: nitrogen-limited medium). Colour bar represents Log2 fold change between batch and pool or late and early steady state. Haplo-insufficiency is shown in blue, and haplo-proficiency is shown in bright red. Data can be seen in S12 and S13 Tables.

