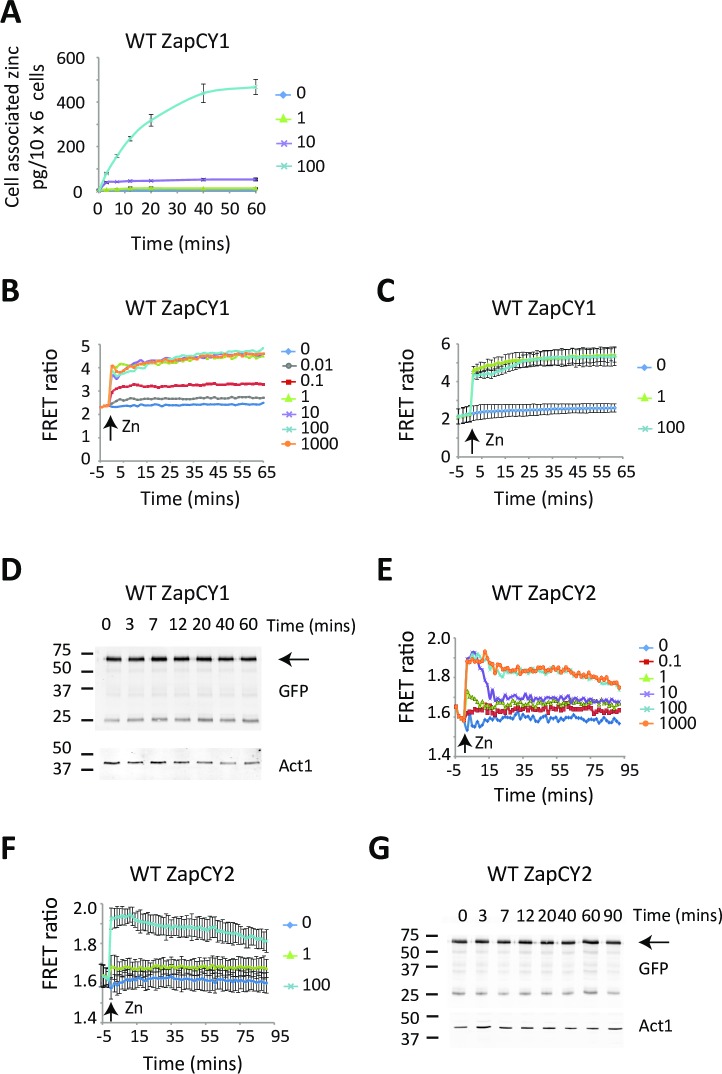
Fig 3. FRET responses of wild-type cells expressing ZapCY1 or ZapCY2 during zinc shock.
(A) Wild-type cells expressing ZapCY1 were grown overnight in ZL-EMM. At t = 0 cells were exposed to 0, 1, 10, or 100 μM. Cells were harvested at the indicated time points and total cellular zinc measured using Atomic Absorption Spectroscopy. The final concentration of zinc/cell was calculated by comparing values to a standard curve. (B and C) Wild-type cells expressing ZapCY1 were grown overnight in ZL-EMM. Cells were transferred to temperature-controlled cuvettes and were assayed for FRET by spectrofluorometry. At t = 0 cells were shocked with 0–1000 μM Zn2+ and the changes in FRET monitored over time. The FRET ratio was determined by dividing the FRET emission at 535 nm by the eCFP emission at 475 nm following excitation of samples at 434 nm. Panel B shows a representative experiment and panel C shows the average values from 3 independent experiments with error bars representing standard deviations. (D) Wild-type cells expressing ZapCY1 were grown overnight in ZL-EMM. At t = 0 cells were shocked with 100 μM Zn2+. At the indicated time point cells were harvested and crude protein extracts prepped for immunoblot analysis. Immunoblots were incubated with antibodies to GFP and loading control Act1. (E and F) Wild-type cells expressing ZapCY2 were grown overnight in ZL-EMM. At t = 0 cells were shocked with 0–1000 μM Zn2+ and the FRET response measured as described in panel B. Panel E shows a representative experiment and panel F shows the average values from 3 independent experiments with error bars representing standard deviations. (G) Wild-type cells expressing ZapCY2 were grown overnight in ZL-EMM. At t = 0 cells were shocked with 10 μM Zn2+. Crude protein extracts were then prepped for immunoblot analysis as described in panel D.

