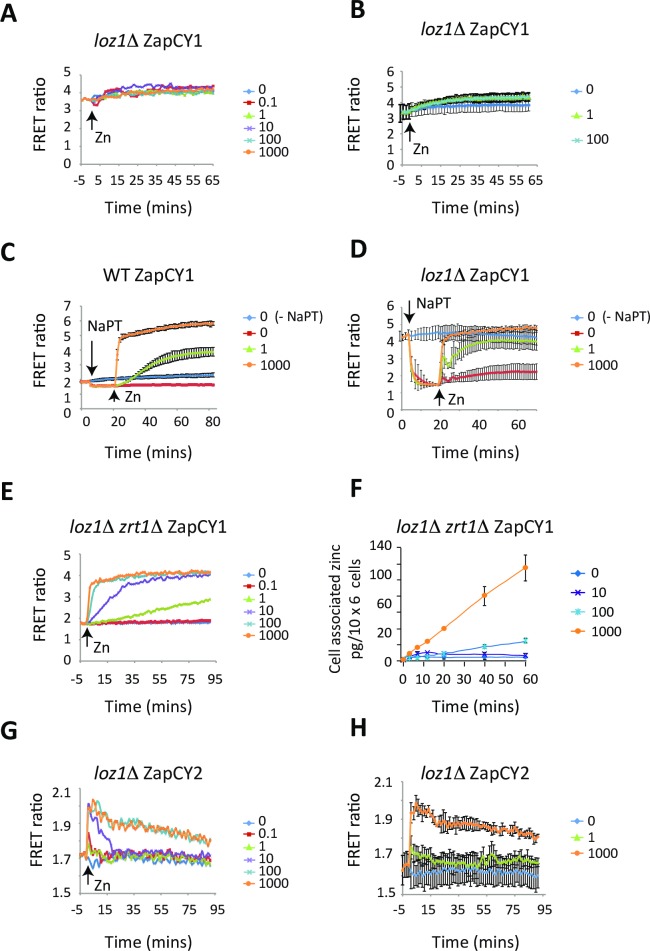
Fig 5. loz1Δ cells accumulate higher levels of zinc in the cytosol under zinc-limiting conditions.
(A and B) loz1Δ cells expressing ZapCY1 were grown overnight in ZL-EMM and cells were transferred to temperature-controlled cuvettes. At t = 0 cells were shocked with 0–1000 μM Zn2+ and changes in the FRET ratio measured as described in Fig 3B. Panel A shows a representative experiment and panel B shows the average values from 3 independent experiments with error bars representing standard deviations. (C and D) Wild-type and loz1Δ cells expressing ZapCY1 were grown overnight in ZL-EMM. Cells were transferred to temperature-controlled cuvettes and at the indicated times were exposed to +/- 50 μM NaPT or 0, 1, or 1000 μM Zn2+. Changes in the FRET ratio were determined as described in Fig 3B. Results show the average values from 3 independent experiments with error bars representing standard deviations. (E) loz1Δ zrt1Δ cells expressing ZapCY1 were grown and subject to zinc shock as described in Fig 3B. A representative experiment is shown. (F) loz1Δ zrt1Δ cells were grown overnight in ZL-EMM. At t = 0 cells were exposed to 0–1000 μM. Total cellular zinc was then determined by AAS as described for Fig 3A. (G and H) loz1Δ cells expressing ZapCY2 were grown overnight in ZL-EMM. Cells were shocked with 0–1000 μM Zn2+ and changes in the FRET ratio measured as described in Fig 3B. Panel G shows a representative experiment and panel H shows the average values from 3 independent experiments with error bars representing standard deviations.

