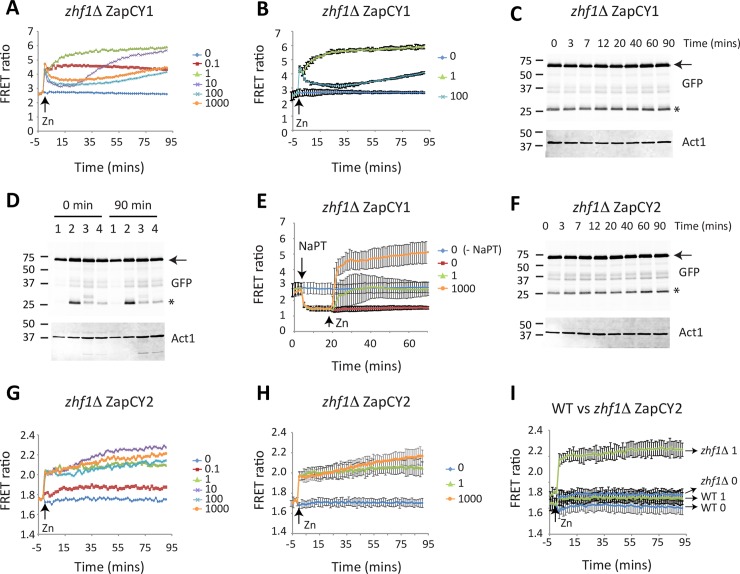
Fig 7. zhf1Δ cells accumulate higher levels of zinc in the cytosol following a zinc shock.
(A and B) zhf1Δ cells expressing ZapCY1 were grown and subject to zinc shock as described in Fig 3B. Panel A shows a representative experiment and panel B shows the average values from 3 independent experiments with error bars representing standard deviations. (C) zhf1x expressing ZapCY1 were grown overnight in ZL-EMM. At t = 0 cells were shocked with 100μM Zn2+. Cells were harvested at the indicated time points and crude protein extracts prepped for immunoblot analysis. Immunoblots were incubated with antibodies to GFP and loading control Act1. (D) Wild-type (1), zhf1Δ (2), cis4Δ (3), and zrg17Δ (4) cells expressing ZapCY1 were grown overnight in ZL-EMM. Cells were harvested for immunoblot analysis following the overnight growth (t = 0) or after a zinc shock with 100 μM Zn2+ for 90 min (t = 90). Immunoblots were performed as described in panel C. (E) zhf1Δ ZapCY1cells were grown overnight in ZL-EMM. Cells were transferred to temperature-controlled cuvettes and were treated with +/- 50 μM NaPT for 20 min followed by the addition of 0–1000 μM Zn2+. Changes in the FRET ratio were determined as described in Fig 3B. (F) zhf1Δ cells expressing ZapCY2 were grown overnight in ZL-EMM. Cells were shocked with 100 μM Zn2+ and cell harvested for immunoblot analysis at the indicated time points. Immunoblots were performed as described in panel C. Results show the average values from 3 independent experiments with error bars representing standard deviations. (G-I) zhf1Δ cells expressing ZapCY2 were grown and subject to zinc shock as described in Fig 3B. Panel F shows a representative experiment and panel G shows the average values from 3 independent experiments with error bars representing standard deviations. Panel I shows a comparison of a 1 μM zinc shock in wild-type and zhf1Δ cells expressing ZapCY2.

