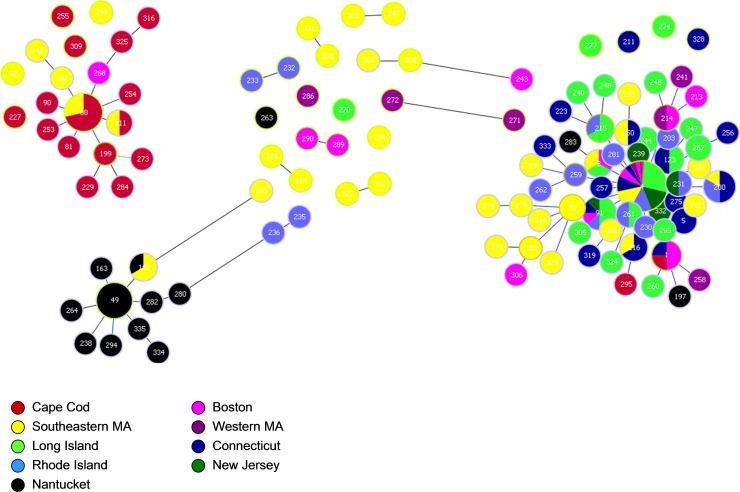
Fig 3. Cluster analysis of B. microti samples using Phyloviz.
Each small bubble represents a unique haplotype. Bubbles are colored to correspond with the region from which the sample originated. The size is not directly correlated with the number of samples. Haplotypes that differ by a single locus are connected with a gray line. The large circles correspond with the population groupings calculated by TESS; blue is the Nantucket population, red is the Cape Cod population, green is mainland population and pink are the haplotypes that showed significant admixture and could not be placed solely in any of the 3 populations. Bubbles that are unconnected to the major groups are placed in the larger circles according to the ancestry coefficients from TESS.

