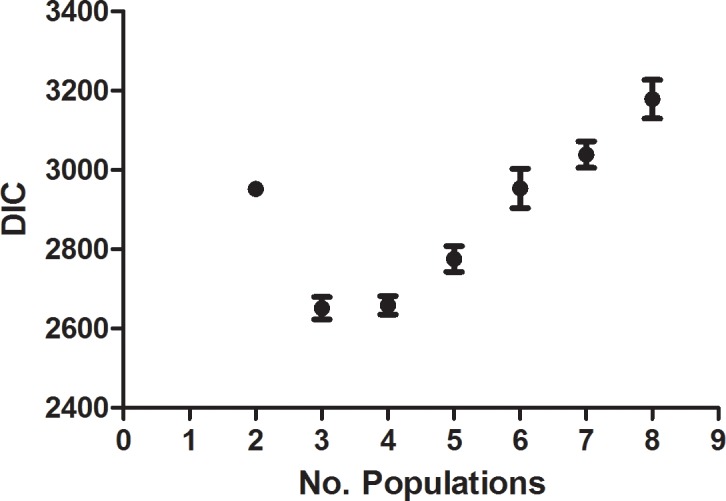
Fig 4. Graph of the mean DIC.

Mean deviance information criterion (DIC) was calculated from 10 individual TESS runs for population size 2–8. Three populations, K = 3, best fit the data.

Mean deviance information criterion (DIC) was calculated from 10 individual TESS runs for population size 2–8. Three populations, K = 3, best fit the data.