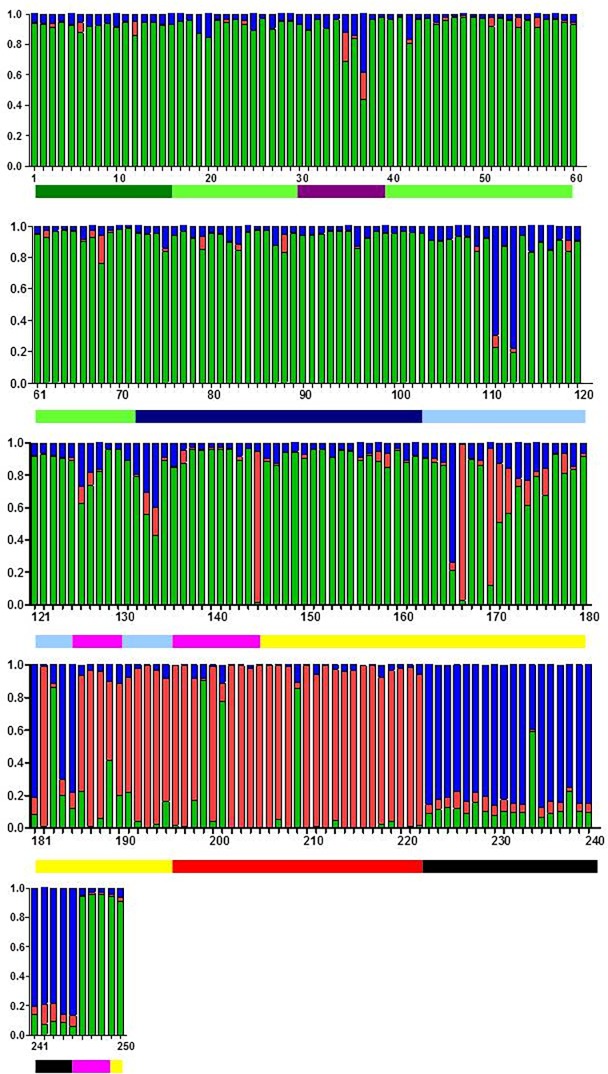
Fig 5. Ancestry coefficients from TESS for K = 3 populations.
Geographic distances between each sample point were calculated using TESS. Green corresponds to the mainland population, red is Cape Cod and blue is Nantucket. Lines beneath the bar chart indicate the source of the sample. Black = Nantucket, light blue = RI, dark blue = CT, purple = WMA, pink = Bos, red = CC, yellow = SeMA, dark green = NJ and light green = LI.

