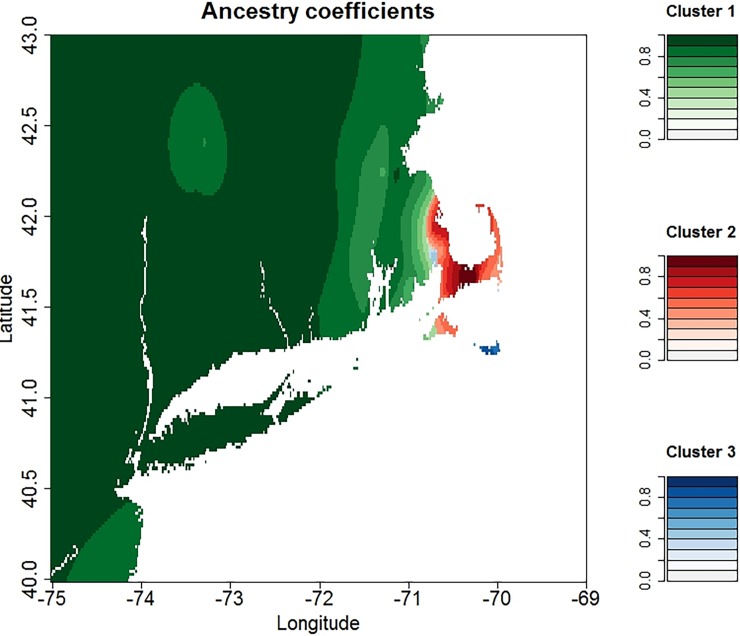
Fig 6. Geographic interpolation of the ancestry coefficients showing the distribution of each population of B. microti.
Cluster 1(green) = mainland population, cluster 2 (red) = Cape Cod population, and cluster 3 (Blue) = Nantucket population. Areas with samples that have a high admixture coefficient, ie a high probability of membership to that population, are shaded darker. Lighter shades indicate areas where there the ancestry coefficients are lower, indicating areas where mixing is occurring. This study did not include data from Martha’s Vineyard; so the predicted populations on that island may be erroneous.

