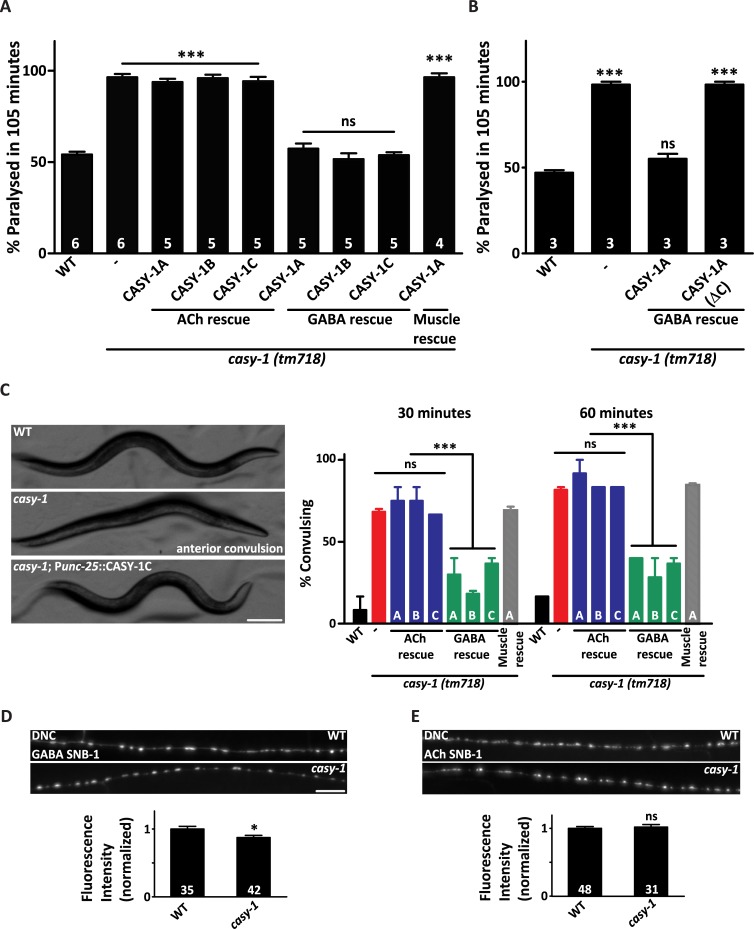
Fig 3. The casy-1 isoforms functions in GABAergic neurons to regulate synaptic transmission.
(A) Expression of CASY-1 isoforms using tissue specific promoters; ACh neurons (Punc-17), GABA neurons (Punc-25) and muscle (Pmyo-3) establishes that expressing CASY-1 in GABAergic neurons completely rescues the Aldicarb hypersensitivity in casy-1 mutants. The number of assays (~20 C. elegans/assay) is indicated for each genotype. (B) The C-terminal of the CASY-1 isoforms functions in GABAergic neurons to regulate synaptic function. The CASY-1A isoform expressed under GABAergic promoter completely rescues the Aldicarb hypersensitivity in casy-1 mutants. However, removing the entire C-terminal from the CASY-1A [CASY-1A (ΔC)] isoform does not rescue the Aldicarb hypersensitivity in casy-1 mutants. The number of assays (~20 C. elegans/assay) is indicated for each genotype. (C) The casy-1 mutants show higher sensitivity to GABA receptor antagonist PTZ than the WT animals. Representative still frame images demonstrating casy-1 mutant C. elegans with anterior convulsions. The still frame images are representative frames from movies (7 frames/second), which are available in the supporting information. Scale bar, 100μm. The graph shows the fraction of animals showing anterior ‘head bobs’ after 30 minute and 60-minute exposure to 10 mg/ml PTZ. The sensitivity to PTZ could be fully rescued by expressing all casy-1 isoforms in GABAergic neurons but not in cholinergic neurons or muscle. Assays were done (~10 C. elegans/assay) at least thrice. Data are represented as mean ± S.E.M. Values that differ significantly from WT animals are indicated (*p<0.01, ***p<0.0001 using one-way ANOVA and Bonferroni's Multiple Comparison Test). Representative fluorescent images of (D) GABAergic [nuIs376 (Punc-25::SNB-1::GFP)] or (E) cholinergic [nuIs152 (Punc-129:: SNB-1::GFP)] synapses in the dorsal cord of WT or casy-1 mutant. Scale bar, 8μm. Cholinergic synapses are largely normal in casy-1 mutants, while GABAergic synapses showed a subtle but significant decrease in fluorescent intensity when compared to WT animals. Quantification of fluorescent intensity is normalized to WT values. The number of animals analyzed for each genotype is indicated at the base of the bar graph. Quantified data are displayed as mean ± S.E.M. and were analyzed by two-tailed Student’s t-test, “ns” indicates not significant in all Figures.

