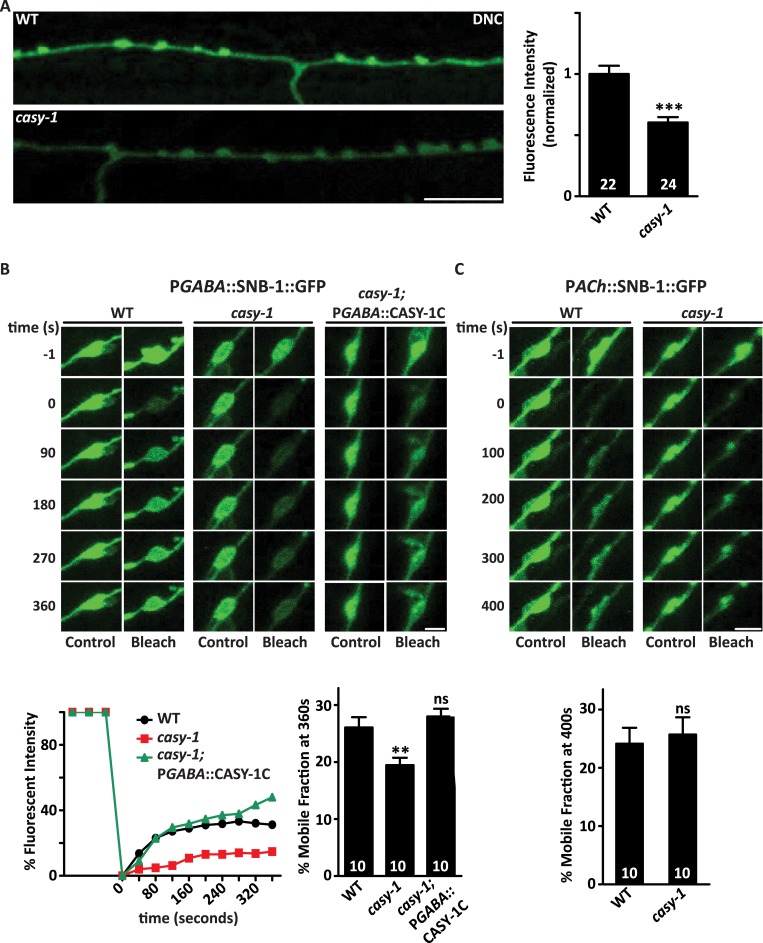
Fig 6. casy-1 isoforms are required for normal GABA release at NMJ.
(A) GABA SV release is compromised in casy-1 mutants. Images show the DNC of adult hermaphrodites expressing pH-sensitive GFP reporter (superecliptic pHluorin) tagged to the luminal domain of synaptobrevin. pHluorin fluorescent intensity is significantly reduced in the casy-1 mutants suggesting fewer GABA vesicles functional at the synapse. Quantification of fluorescent intensity is normalized to WT values. The number of animals analyzed for each genotype is indicated at the base of the bar graph. Quantified data are displayed as mean ± S.E.M. and were analyzed by two-tailed Student’s t-test. Scale bar, 8μm. (B) FRAP analysis of SNB-1::GFP levels in GABAergic motor neurons reveals that the dynamics of SV mobility is reduced in casy-1 mutants. Representative confocal images of pGABAergic::SNB-1::GFP levels compared between WT, casy-1 and casy-1; pGABAergic::CASY-1C rescue shows images before photo-bleaching (pre-bleach), immediately after photo-bleaching (post-bleach) and 360 sec after photo-bleaching (recovery). Scale bar, 2μm. At time 0, a single puncta of SNB-1::GFP was photo-bleached. Recovery of SNB-1::GFP levels were subsequently monitored at the photo-bleached and a neighboring control puncta. The fractional recovery of fluorescence 360 sec after photo-bleaching is shown. Recovery was measured with the pre-bleach fluorescence intensity being 100% and the post-bleach intensity at time 0 being 0%. The fluorescence intensity of control unbleached puncta did not change significantly during the period of recovery. (C) FRAP analysis of SNB-1::GFP levels in cholinergic motor neurons illustrated that mobility dynamics of SNB-1::GFP is normal in cholinergic motor neurons in casy-1 mutant animals. Representative confocal images of pCholinergic::SNB-1::GFP levels images prior to photo-bleaching (pre-bleach), immediately after photo-bleaching (post-bleach) and 400 sec after photo-bleaching (recovery) Scale bar, 2μm. The fractional recovery of fluorescence 400 sec after photo-bleaching is shown. The number of animals analyzed are indicated for each genotype. Data are represented as mean ± S.E.M. (**p<0.001 using one-way ANOVA and Bonferroni's Multiple Comparison Test).

