
Figure 6.
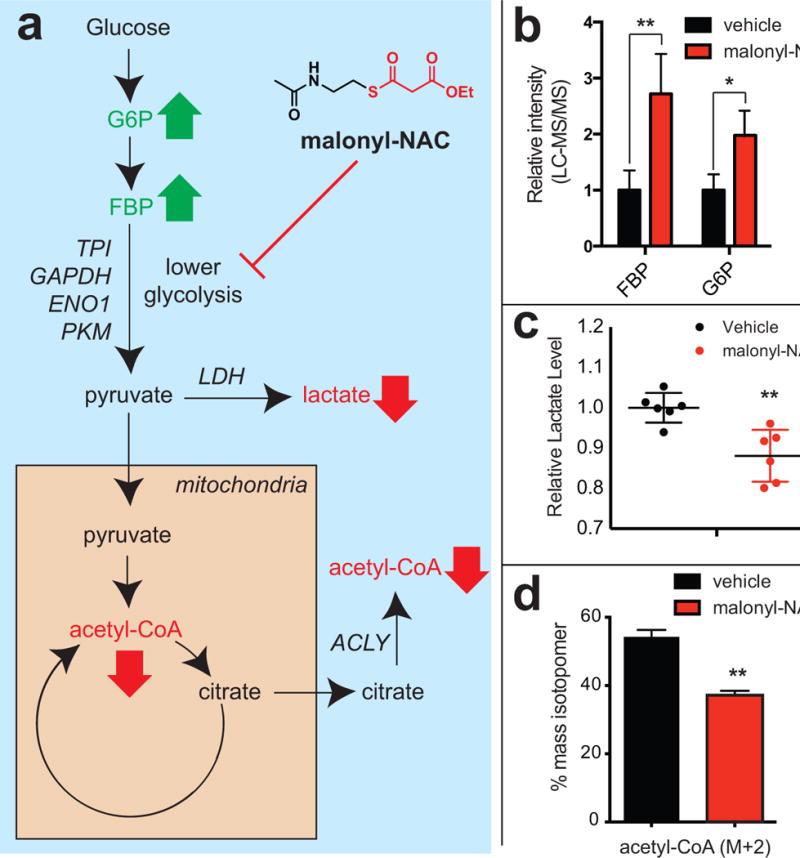
Exploring the effects of cytosolic thioester reactivity on cellular glucose metabolism. (a) Schematic of glycolysis. Bold green and red arrows reflect expected changes in abundance of metabolites that lie upstream and downstream of glycolytic enzymes targeted by non-enzymatic acylation. Gene names in italic refer to high confidence targets of non-enzymatic acylation where malonyl-NAC may intervene. (b) Effects of malonyl-NAC (1 mM, 24 h) on glucose-6-phosphate (G6P) and fructose-1,6-bisphosphate (FBP) levels in A549 cells. (c) Effects of malonyl-NAC (1 mM, 24 h) on lactate levels in A549 cells. (d) Effects of malonyl-NAC (1 mM, 24 h) on glucose-derived acetyl-CoA (M+2) in A549 cells. Metabolomic measurements represent the average of ≥3 replicates, with significance analyzed by unpaired Student’s t test (ns = not significant, * = P < 0.05, ** = P < 0.01)