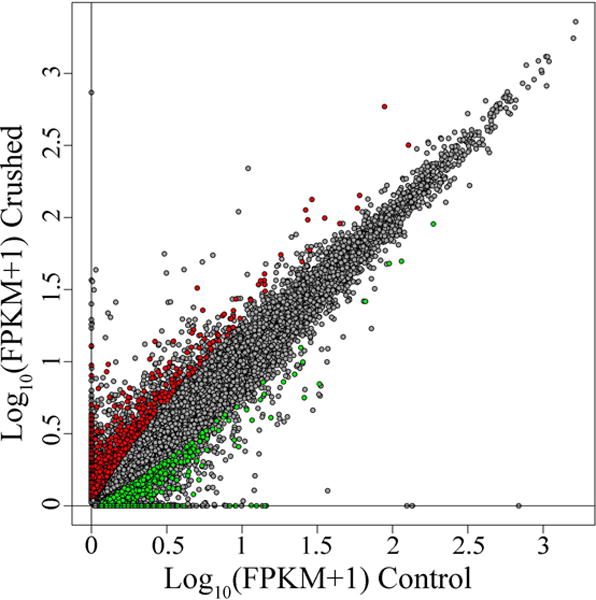
Fig. 4. Thousands of isoforms are differentially expressed in DRG neurons 7 days after axotomy.

Adult mice underwent sciatic nerve crush (Crushed, y-axis) or sham surgery (Controls, x-axis). 7 days post injury the ganglia at the L3, L4 and L5 levels were dissected and neurons were collected by laser microdissection. RNA-Seq technology was used to analyze changes in RNA expression at the isoform level. Grey dots in the scatterplot represent isoforms. The x axis represents the log10 of the expression value in the control samples (reported in FPKM + 1). The y-axis represents the log10 of the expression value in the crushed samples. In red are the isoforms that passed a Jensen-Shannon divergence test for differential expression (FDR corrected p-value < 0.05) and meet our arbitrary threshold for meaningful change (Log2 of the Fold Change <-1 or >1). In green are the isoforms that did not pass the statistical test (FDR corrected p-value > 0.05) or did not meet the Fold Change threshold (Log2 of the Fold Change >-1 and <1). A total of 2682 isoforms were called differentially expressed.
