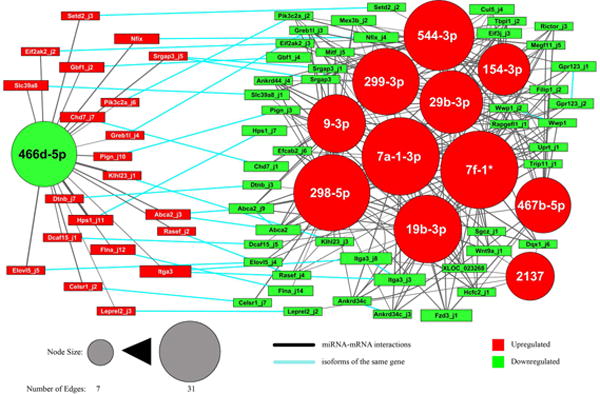
Fig. 6. MRE analysis identifies core network of interactions behind DRG regeneration.

miRNA binding site analysis was used to predict interactions between miRNAs and mRNA isoforms. The isoforms were filtered to identify the core of the network of interactions (see Methods and Results). The resulting network is reported, where nodes are miRNAs (circles) and isoforms (boxes). Red nodes were upregulated in vivo after axotomy, green nodes were downregulated. Node size is proportional to the number of edges connecting it. Edge thickness is inversely correlated with the interaction score (see Methods). Blue edges connect isoforms of the same gene.
