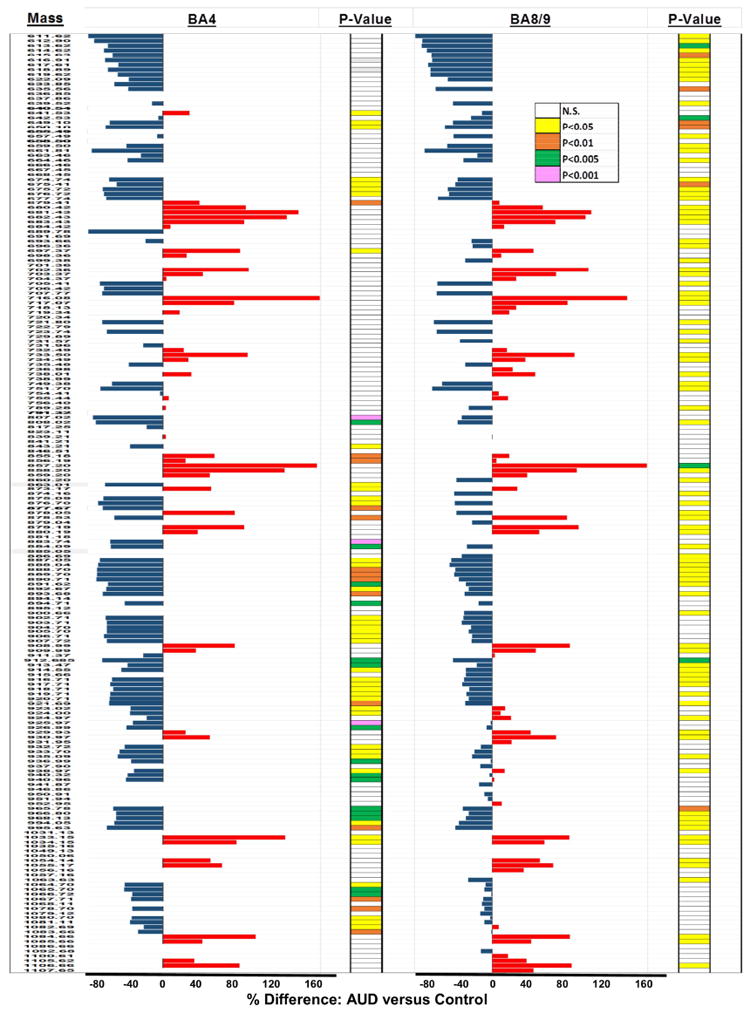
Figure 2.

Data Bar Plots illustrating effects of AUD on lipid ion expression in BA4 and BA8/9 human frontal lobe WM as detected by MALDI-IMS in the negative ionization mode: Plots depict the calculated percentage differences in the mean levels of each lipid ion expressed. The scale bars depict the range of responses from -80% to +160% relative to control. T-test results (P-Values) from comparing the mean levels of each lipid ion in control and AUD groups are color-coded to the right of each data bar plot. Results are organized with respect to increasing m/z values. See Supplementary Table 1 for lipid identifications. Blue bars to the left of the vertical axis reflect AUD-associated reductions in lipid expression, and red bars to the right correspond to mean percentage increases in lipid expression.
