
Figure 1. Optogenetic Manipulation and Identification of Spiking Activity of SOM and PV Cells.
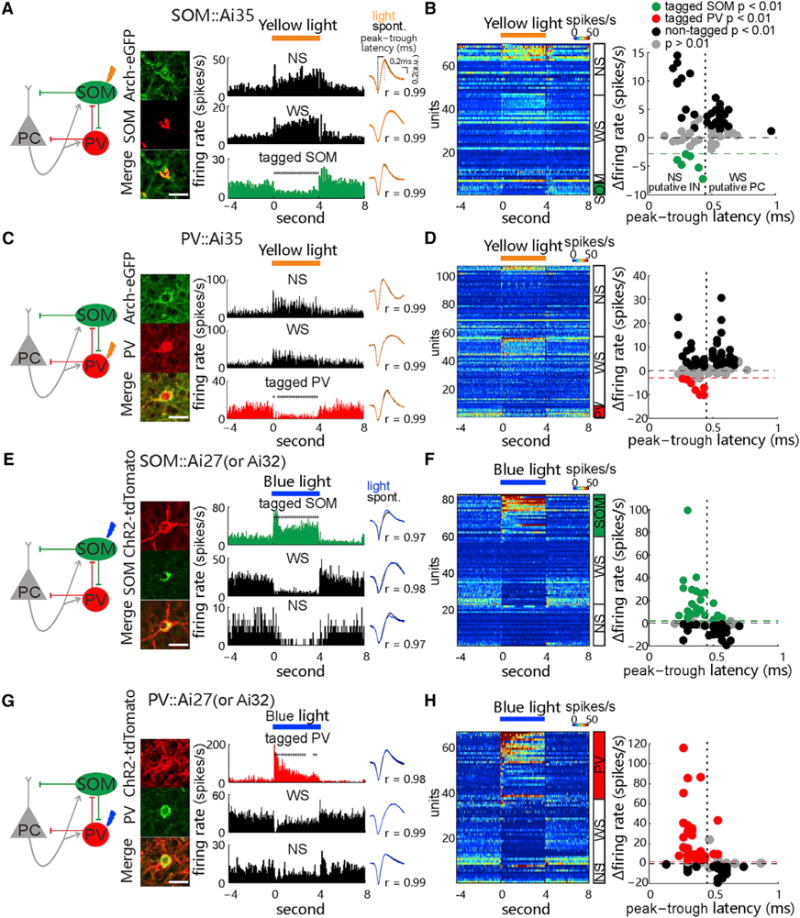
(A) Left: diagram of synaptic circuit formed by excitatory pyramidal cells (PCs) and inhibitory somatostatin (SOM)- and pavalbumin (PV)-expressing INs, with yellow arrow indicating optogenetic inactivation of SOM cells. Middle: fluorescence images show immunostained SOM cells (red) expressing Arch-EGFP (green) in the V1 of SOM::Ai35 mice. Scale bar, 20 μm. Right: peri-stimulus time histograms (PSTHs) of spike rates were recorded from the tagged SOM cell and non-tagged wide-spike (WS, putative PC) and narrow-spike cells (NS, putative IN) in the presence of 4-s 589-nm laser stimulation (30 mW, 30 repeats), with cross-comparison of spike waveforms in light off and on conditions (Pearson’s correlation value, r) in a SOM::Ai35 mouse. Asterisks: time bins showing significant rate changes (200-ms time bins; p < 0.05, Wilcoxon two-sided signed-rank test, versus baseline rate).
(B) Left: PSTHs of all recorded tagged SOM cells and non-tagged WS and NS cells, ranked by light-induced firing rate amplitudes (encoded by colors) in each cell group. Right: plot shows the firing rate changes and the peak-to-trough latency of spike waveform of all units. Units showing significant light-induced suppression of firing rates were tagged as SOM cell (n = 6 of 70 units in 19 mice; p < 0.01, permutation test; green dashed line depicts the minimum decrease of spike rate by 3 Hz). Black and gray dots represent those units showing significant increase (p < 0.01, non-tagged) and no significant change (p > 0.01) in firing rates, respectively, during laser stimulation. The peak-to-trough latency of 0.45 ms is chosen to roughly separate putative WS and NS groups.
(C and D) Similar to (A) and (B), respectively, but tests are in the PV::Ai35 mice, with 8 tagged PV cells (from 107 units in 24 mice; p < 0.01, red).
(E–H) Similar to (A)–(D) but tests are in the SOM::Ai27/Ai32 (E and F) and PV::Ai27/32 (G and H) mice, respectively, using the optogenetic tagging with activating ChR2-expressing cells by the 473-nm laser (30 mW, 4-s duration). 23 t-SOM cells (from 82 units in 12 SOM::Ai27 and 9 SOM::Ai32 mice; p < 0.01; green in F, green dashed line depicts the minimum increase of spike rate by 2 Hz) and 30 t-PV cells (from 67 units in 20 PV::Ai27 and 6 PV::Ai32 mice; p < 0.01; red in H) are identified. See also Figures S1 and S6.