
Figure 2. Stronger Correlation of PV Cell Spiking with Spontaneous gamma Oscillation.
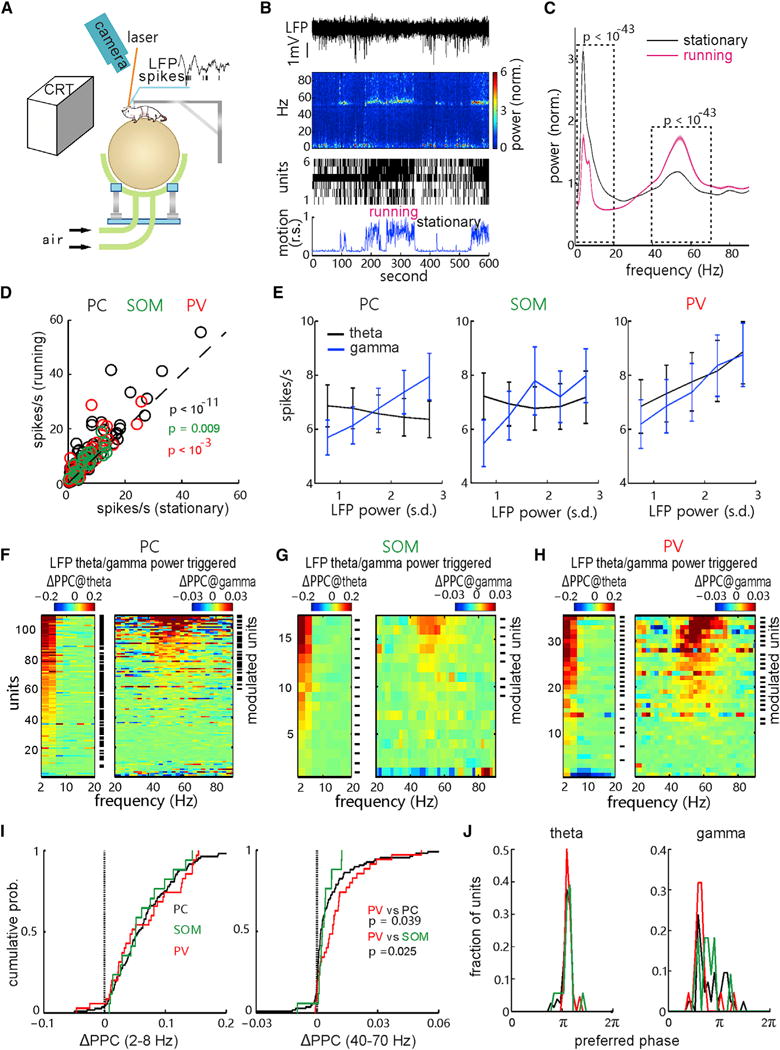
(A) A diagram depicting the head-fixed awake mouse experiment with visual stimulation, behavioral state monitoring, optical-fiber laser stimulation, and in vivo extracellular recording.
(B) Example of the complete data, including the raw local field potential (LFP), the corresponding power spectrogram (top), the raster plot of spiking units recorded simultaneously (middle), and the animal motion trace (relative speed [r.s.], bottom).
(C) Plots of mean LFP power spectrum of all recordings in the stationary and running states, respectively (n = 274 recordings in 61 mice; 1–20 Hz, p < 10−43; 40–70 Hz, p < 10−43, Wilcoxon two-sided signed-rank test, stationary versus running; shaded areas, SEM).
(D) Comparison of the spontaneous firing rates of putative PCs (WS units, black; n = 114 units in 40 mice; p < 10−11, Wilcoxon two-sided signed-rank test), t-SOM cells (green; n = 23 in 17 mice; p = 0.009), and t-PV cells (red; n = 39 in 23 mice; p < 10−3) in the stationary and running states.
(E) Correlation between the firing rates of each cell population and LFP power (normalized to SD) of theta band (2–8 Hz, black; PC, r = 0.9, p = 0.083; SOM, r = −0.3, p = 0.683; PV, r = 1, p = 0.016) or gamma band (40–70 Hz, blue; PC, r = 1, p = 0.016; SOM, r = 0.9, p = 0.083; PV, r = 1, p = 0.016, Spearman two-tailed rank correlation test; error bar, SEM).
(F–H) Changes of the spike-LFP pairwise phase consistency (PPC) of putative PCs (F), tagged SOM cells (G), or tagged PV cells (H) along with the change of spontaneous theta (2- to 8-Hz, left) or gamma (40- to 70-Hz, right) band LFP activity: ΔPPC@theta/gamma = PPCspikes with high LFP amplitude − PPCspikes with low LFP amplitude (high and low was classified by the mean). Numbers of units showing significant PPC increases in theta or gamma band (labeled by short black lines; p < 0.01, permutation test) are: 80 and 30 units from all 108 WS-PC cells (F), 17 and 9 units from all 17 t-SOM cells (G), and 25 and 21 units from all 35 t-PV cells (H).
(I) Cumulative distribution of the PPC change of the three cell populations in theta (left) and gamma (right) bands, respectively. There is no difference in the theta band PPC changes among three populations (PV versus PC, p = 0.663; PV versus SOM, p = 0.968; SOM versus PC, p = 0.967, Kolmogorov-Smirnov test; left), but there is a significant difference in the gamma band PPC changes among three populations (PV versus PC, p = 0.039; PV versus SOM, p = 0.025; SOM versus PC, p = 0.192; right).
(J) Unit count fraction distributions of recorded PCs, SOM cells, and PV cells along their preferred firing LFP theta (left) and gamma (right) phases (π represent the trough of each cycle). See also Figures S2 and S3.