
Figure 3. Differential Correlations between the Spiking of PCs, SOM Cells, and PV Cells with Visually Induced beta and gamma Oscillations.
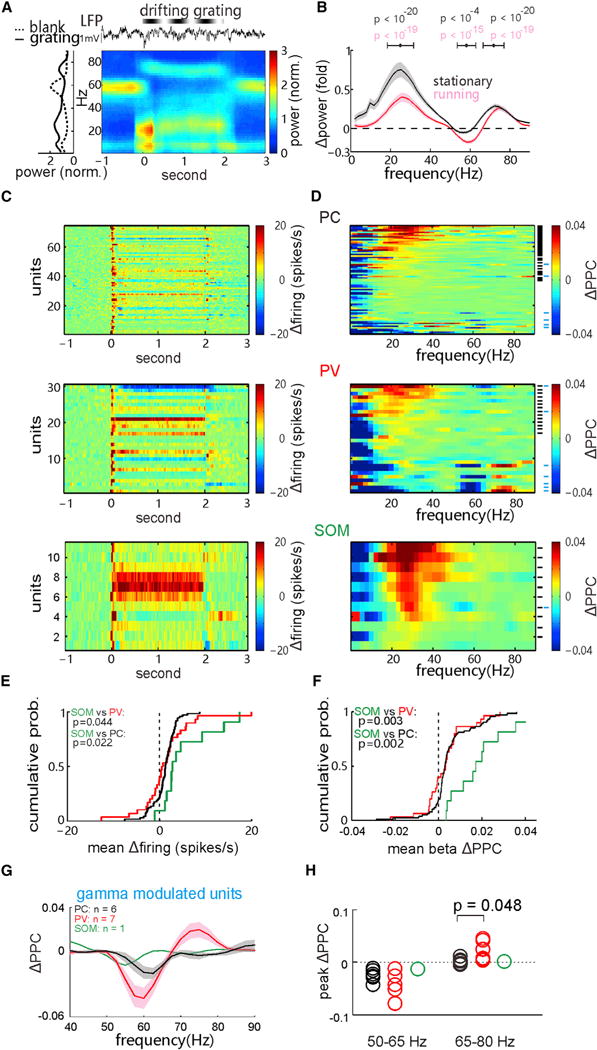
(A) Examples of the raw LFP, corresponding time-frequency spectrogram (average over trials) and the average (over time) power spectrum before and during the drifting-grating stimulation.
(B) Mean LFP power change, Δpower = (powergrating − powerblank)/powerblank, elicited by the grating stimulation in the stationary and running states, respectively (shaded area, SEM; n = 131 recording sites in 44 mice). The p values of power changes around the peak frequency in three bands, 15–40, 50–65, and 65–80 Hz were calculated by Wilcoxon two-sided signed-rank test.
(C) PSTHs of evoked firing rates (Δfiring rate − baseline mean rate) in all recorded PCs (top), tagged PV cells (middle), and tagged SOM cells (bottom).
(D) Stimulation-induced PPC changes (ΔPPC = PPCgrating − PPCblank) in the PCs (top, n = 74), tagged PV cells (middle, n = 30), and tagged SOM cells (bottom, n = 11). Short black lines, the beta-modulated cells with significant increases of induced beta band PPC (34 PCs, 14 PV cells, and 10 SOM cells; p < 0.01, permutation test); short cyan lines, the gamma-modulated cells with significant changes in induced gamma band PPC (relative to the 50- to 65-Hz gamma decrease or the 65- to 80-Hz high gamma increase, p < 0.01).
(E) Comparisons of the distribution of evoked firing rates of the PCs and tagged PV and SOM cells. The p values were calculated by Kolmogorov-Smirnov test.
(F) Cumulative distributions of mean beta band ΔPPC of the PCs and tagged PV and SOM cells.
(G) The mean ΔPPC of the gamma-modulated cells as indicated in (D) (shaded area, SEM).
(H) The peak PPC changes in the 50- to 65-Hz gamma and 65- to 80-Hz high gamma bands among the three cell populations. The p value was calculated by Kolmogorov-Smirnov test. See also Figures S2–S5.