
Figure 4. Effects of Visual Stimulus Size on Neuronal Spiking and Oscillatory Activity.
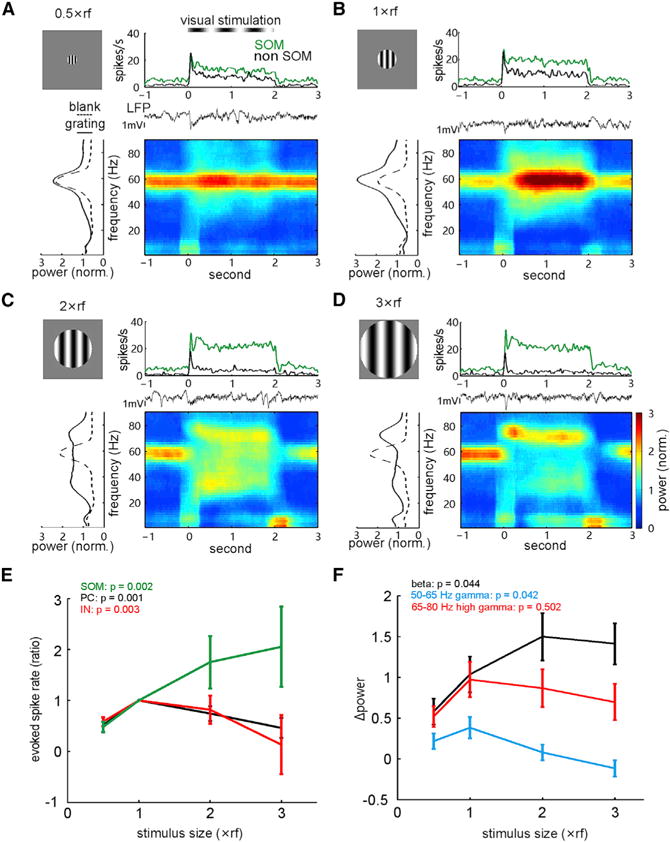
(A–D) Evoked spike rates of a tagged SOM cell and another untagged neuron as well as the LFP power spectra under the stimulation of drifting grating at 0.5× (A), 1× (B), 2× (C), and 3× (D) size of the receptive field (estimated by visually evoked potentials).
(E) Changes of the evoked mean rates (normalized to the value measured at 1× rf stimulation size) of tagged SOM cells (n = 5), putative PC-WS cells (n = 13), and IN-NS (n = 9) cells with increasing the stimulus size. Error bars, SEM.
(F) Dependence of induced changes of LFP power in beta (peak frequency, 25.6 ± 4.9 Hz), 50- to 65-Hz gamma (56.4 ± 1.9 Hz), and 65- to 80-Hz high gamma (69.3 ± 2.8 Hz) bands on stimulus size (n = 8 recording sites in 8 mice). p values were calculated by the Kruskal-Wallis ANOVA test.