
Figure 6. Differential Regulation of Visually Induced Oscillations by SOM and PV Cells.
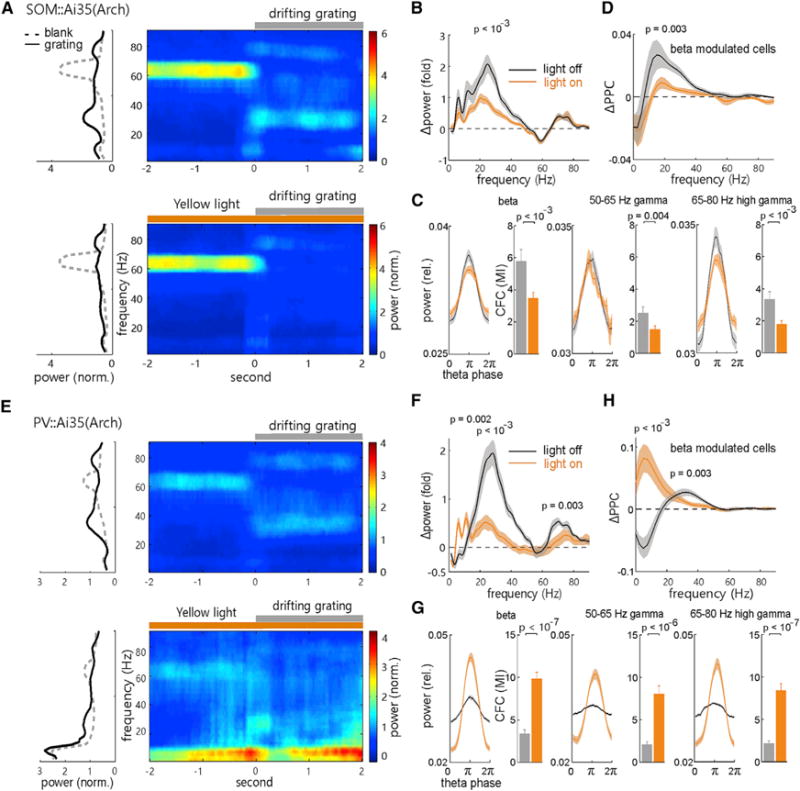
(A) Trial-averaged LFP time-frequency spectrogram (right) and the averaged (over time) power spectrum during the 2-s blank and 2-s drifting-grating stimulation (left) under the off (top) and on (bottom) of the 6-s yellow light stimulation in the V1 of a SOM::Ai35 mouse.
(B) Comparison of the visually induced mean change of LFP power spectrum during the light on (yellow) and off (black) periods. The p values for mean Δpower in the 1–10 Hz range, around the peak frequency of beta, 50- to 65-Hz baseline, and 65- to 80-Hz high gamma bands were calculated by Wilcoxon two-sided signed-rank test, respectively (n = 16 recordings in 8 mice, light off versus light on).
(C) Comparisons of mean LFP power of the beta, baseline gamma, and high gamma bands over the theta cycle phases, and their strength of cross-frequency coupling (CFC), during the light off (gray) and on (yellow) periods. The p values were calculated by Wilcoxon two-sided signed-rank test.
(D) Comparisons of the visually induced mean change of spike-LFP PPC (ΔPPC = PPCgrating − PPCblank) over the frequency in the beta-modulated cells (as labeled in Figure 3D) during the light off and light on periods. The p values were calculated by Wilcoxon two-sided signed-rank test (n = 12 PCs, 4 putative INs; light off versus light on).
(E–H) Similar to (A)–(D), respectively, except for the analysis of recorded units and LFPs from the PV::Ai35 mice (n = 12 recordings in 10 mice; PC, n = 14; putative IN, n = 6). All error bars and shaded areas represent SEM. See also Figure S2.