
Figure 7. SOM and PV Cells Preferentially Pace Narrow Low-Frequency Band and Wide High-Frequency Band Activities, Respectively.
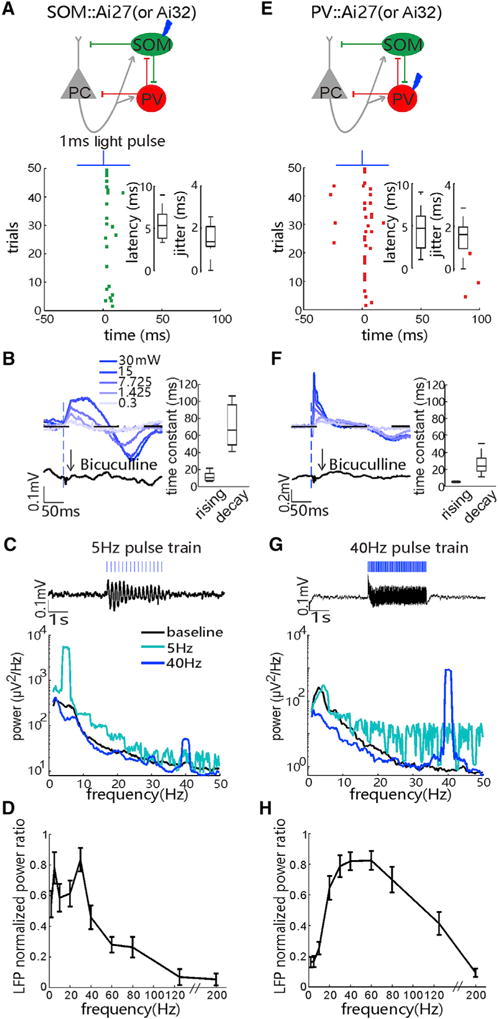
(A) Top: a circuit diagram where ChR2-expressing SOM cells are rhythmically activated by 1-ms blue laser pulses (473 nm, 30 mW). Bottom: raster plot shows evoked spikes of a tagged SOM cell in the SOM::Ai27 mouse. Insets: box-and-whisker plots of the spike latencies and jitters of laser pulse-evoked first spikes in the SOM cells are shown (n = 23 recordings in 22 mice; p < 0.01, tested by stimulus-associated spike latency test [SALT]).
(B) Raw average local field potentials (LFPs) evoked by1-ms laser pulse to activate ChR2-expressing SOM cells, with increasing laser power from 0.3 to 30 mW, and the blockade of evoked LFPs (at 30 mW) by the epipial infusion of bicuculline (GABAA receptor antagonist). Right: time constants of the rising and decay phases of evoked LFPs are shown (at 30 mW; n = 25 recordings in 7 mice).
(C) Top: trace of averaged resonant activity in LFPs under the 5-Hz stimulation of 1-ms blue laser pulses to ChR2-expressing SOM cells. Bottom: averaged power spectrum of LFPs during the baseline and the 5- and 40-Hz stimulation of laser pulses is shown.
(D) Average LFP’s power changes (powerlight/powerbaseline) induced by rhythmic activation of ChR2-expressing SOM cells with blue laser pulses at frequencies ranging from 1 to 200 Hz. Note that power values are normalized to the maximum power change in all tested frequency conditions (n = 9 recordings in 3 SOM::Ai27 and 3 SOM::Ai32 mice). Error bars, SEM.
(E–H) Similar to (A)–(D), respectively, except for the data of optogenetic activation of ChR2-expressing PV cells from the PV::Ai27 (or Ai32) mice (n = 30 PV cells in 21 mice in E; n = 12 recordings in 9 mice in F; n = 10 recordings in 7 PV::Ai27 and 2 PV::Ai32 mice in H). See also Figure S6.