
Figure 6.
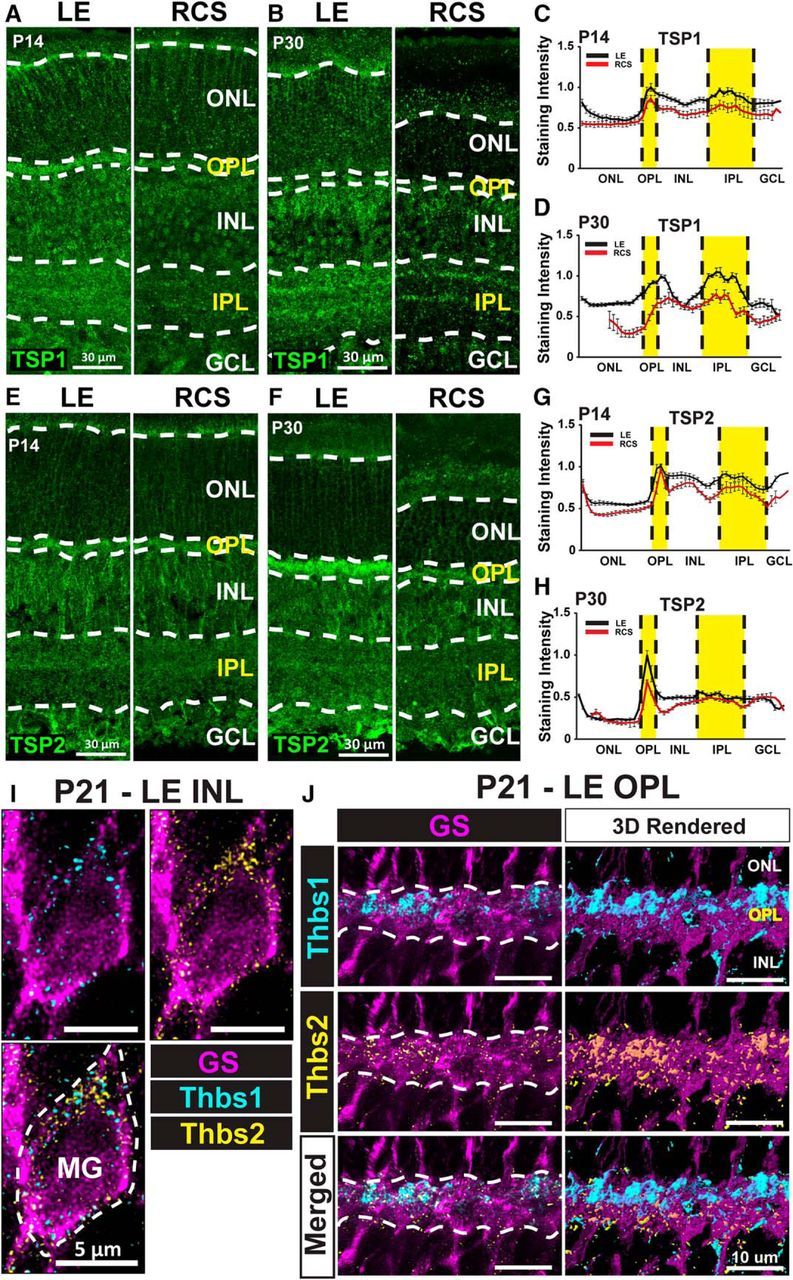
TSP1 and TSP2, expressed by MG, are reduced in RCS rat retinas. A, Representative images of the retina stained for TSP1 from LE (healthy) and RCS (degenerative) rats on P14 and (B) P30. Quantitative staining intensity analysis demonstrated that TSP1 is enriched in the synaptic layers, the expression was reduced in the RCS rat as early as (C) P14, and the expression gap became more distinct on (D) P30. Representative images of the retina stained for TSP2 on (E) P14 and (F) P30. Quantitative staining intensity analysis demonstrated that TSP2 was enriched in the OPL, the expression was reduced in RCS rat as early as (G) P14, and the expression gap became larger on (H) P30. I, Confocal microscopy images showing fluorescent spots corresponding to Thbs1 (cyan) and Thbs2 (yellow) mRNA in GS+ cell bodies (dashed line) in rat retina. J, The Thbs1 and Thbs2 mRNAs were also enriched in the synaptic layers in GS+ processes. 3D rendered images (right panels).