Figure 2.

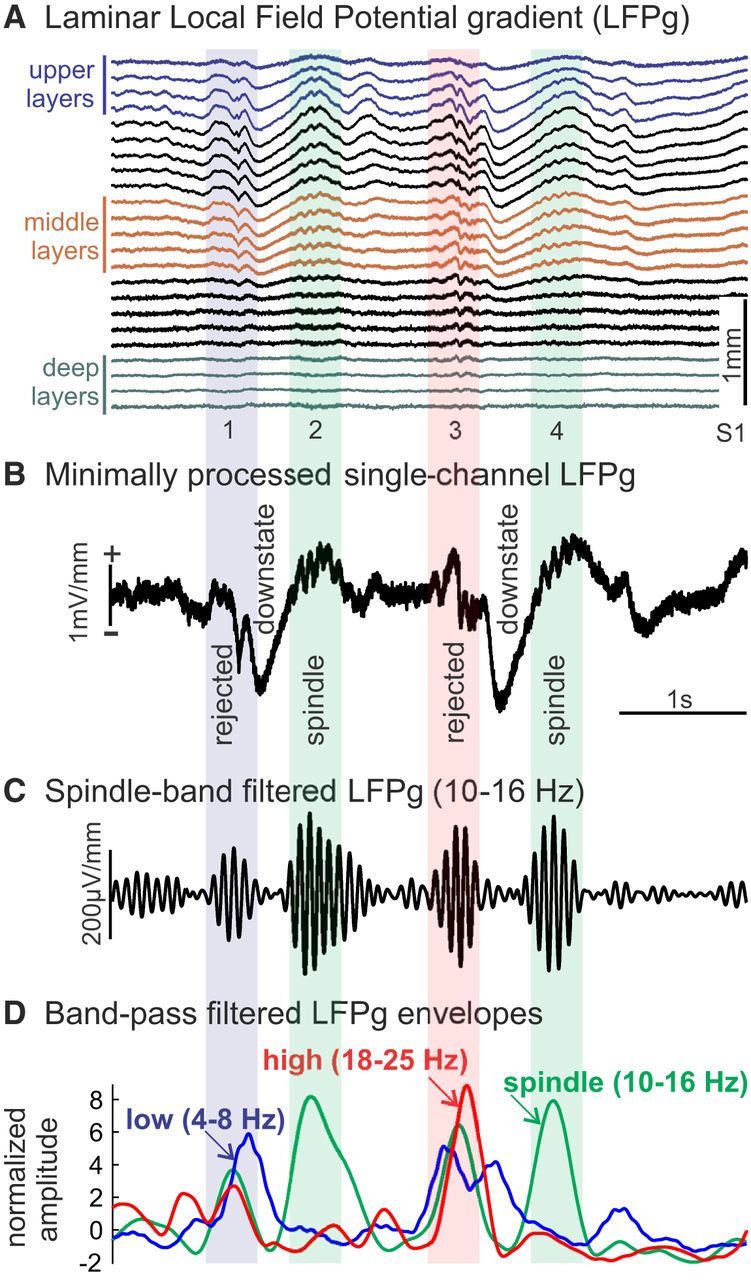
Spindle detection. A, Example of laminar recordings of two spindles (2, 4) following downstates. The first spindle is clear in both upper channels (blue traces) and middle channels (brown traces), whereas the second is only clear in middle channels. Data were minimally preprocessed: 60 Hz notch filter, interpolation to replace bad channels and slight spatial smoothing. B, Spindles detected in one middle channel are marked with green background. Potential spindle events were rejected for excessive low-frequency (blue bar, event 1) or high-frequency (red bar, event 3) power. C, Bandpass filtered data in spindle band (10–16 Hz) from middle layer channel. D, Normalized amplitude envelopes of low- (4–8 Hz), spindle-, and high-band (18–25 Hz) oscillations.
