Figure 3.
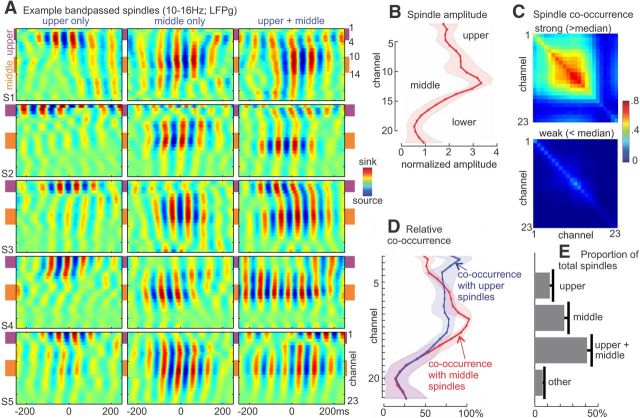
Spindle amplitudes and occurrence across channels. A, Examples of spindle activity (bandpass filtered, 10–16 Hz) detected in upper channels only, middle channels only, or both upper and middle channels. Each plot is normalized to its maximum absolute value. B, Group average (n = 5) of peak normalized spindle-band amplitude averaged across all epochs for each channel. Shaded region represents 95% CI (1.96 × SEM). C, Top, Spindle co-occurrence matrix for “strong” spindles, with maximum amplitude greater than the median. Bottom, Co-occurrence matrix for “weak” spindles. Displayed values represent the number of “strong” or “weak” spindles detected in a given channel or pair of channels divided by the total number of “strong” or “weak” spindles detected in any channel for a given subject. Thus, the diagonal indicates the proportion of total spindles that included that particular channel. The plot suggests that strong spindles usually involved multiple middle channels, whereas weak spindles tended to occur in a single channel. D, Relative co-occurrence rates for epochs containing a spindle in either upper or middle channels. E, Group average of the fraction of spindles detected in upper channels only, middle channels only, upper and middle channels, or other channels.

