Figure 4.
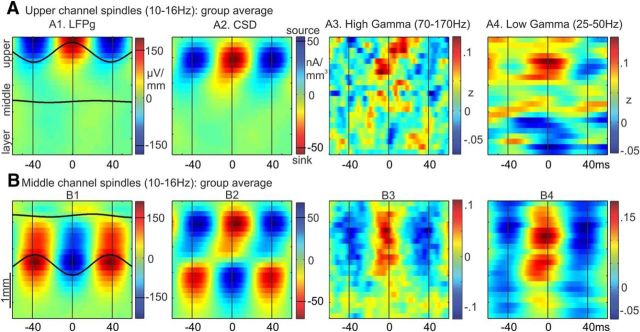
Laminar sources of spindle oscillations. A1, Group average of waveforms that had been averaged across epochs and individual peaks (bandpass filtered, 10–16 Hz), time-locked to spindle peaks in the upper channel (channels 1–4) with the highest spindle rate for each subject. Only above-median upper channel spindle epochs were included. Waveforms are superimposed on a time-amplitude plot of LFPg in the same epochs. Time-amplitude plots from these epochs are also shown for the following: A2, CSD. A3, High gamma (70–170 Hz) amplitude. A4, Low gamma (25–50 Hz) amplitude. B, The same plots are shown, except in this case averages were made for middle channel spindle epochs time-locked to the middle channel (channels 10–14) with the highest spindle rate for each subject.

