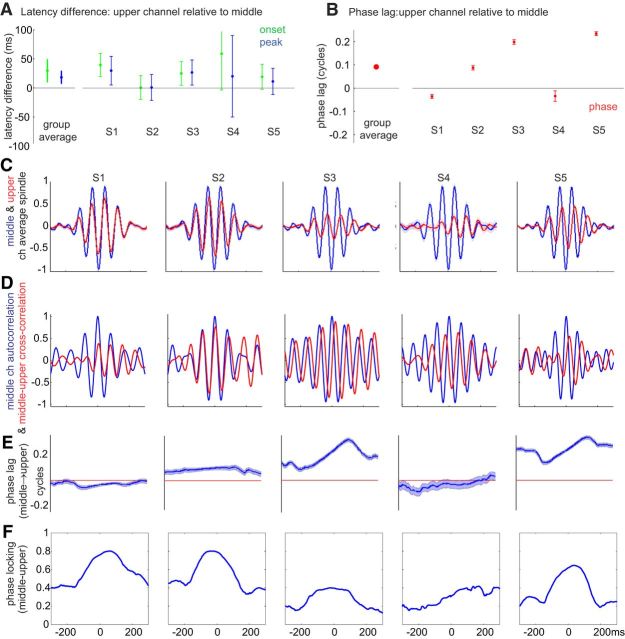
Figure 6.
Spindle timing differences between channels. A, Latency differences between upper and middle channels for spindle epoch onset and peak of spindle-band amplitude envelope, averaged across spindle epochs. Left, Group average. Right, Individual subjects. Error bars indicate 95% CI (1.96 × SEM). B, Phase lag of upper channels relative to middle channels (selected for each subject based on spindle rate). C, Normalized spindle waveforms averaged across epochs, time-locked to the middle channel (channels 10–14) with the highest spindle rate for each subject (arranged left to right). Blue represents middle channel. Red represents upper channel. D, Cross-correlation of selected upper and middle channels for each subject, averaged across epochs. Blue represents autocorrelation for middle channel. Red represents cross-correlation between upper and middle channel. E, Phase lag averaged across epochs. F, Phase locking. B–E, The upper layer spindles in Subjects 2, 3, and 5 were inverted before plotting because their responses were >0.25 cycle displaced from the middle layer spindles, suggesting phase wrapping (see Materials and Methods).

