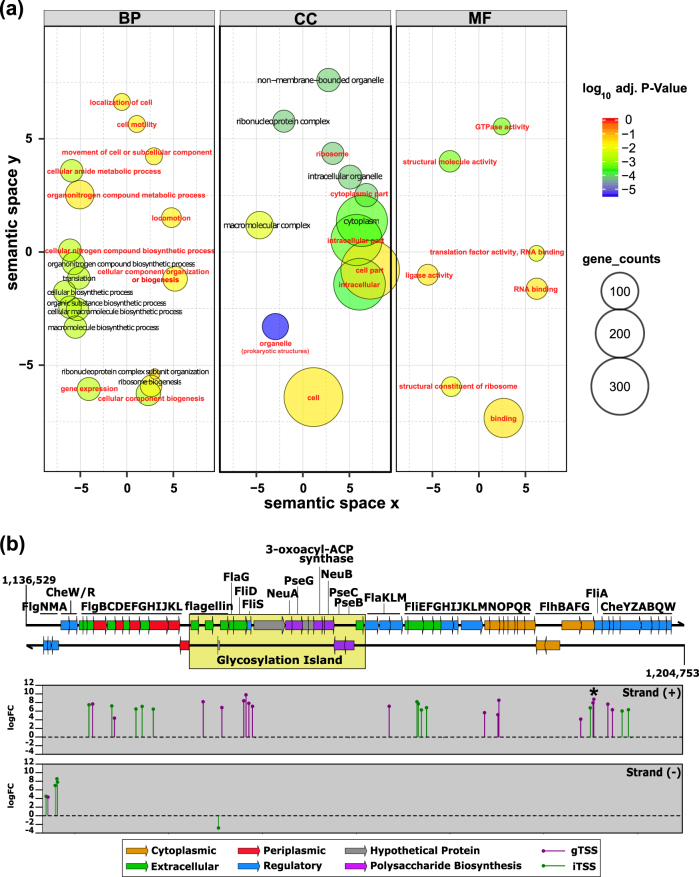
Fig. 3.
a Enriched GO terms for genes upregulated at 43 ppt. In order to cluster semantically similar GO terms together and to reduce redundancy, pairwise semantic similarities of enriched GO terms were calculated using REVIGO with the SimRel method [106]. Terms with a dispensability <0.4 were taken as representatives and highlighted in bold font and red color, redundant terms are shown in black. Only GO terms with an adjusted p-value < 0.05 are shown. Circle sizes correspond to the counts of differentially expressed genes involved in that GO term. BP biological process, CC cellular component, MF molecular function. b Expression of the flagellar gene cluster. TSSs differentially expressed at 43 ppt are indicated in the lower two panels, separately for the forward and the reverse strand. Two strongly activated TSSs for the fliA gene are highlighted with an asterisk symbol. The variable region is highlighted by the yellow box. logFC log2-transformed fold changes

