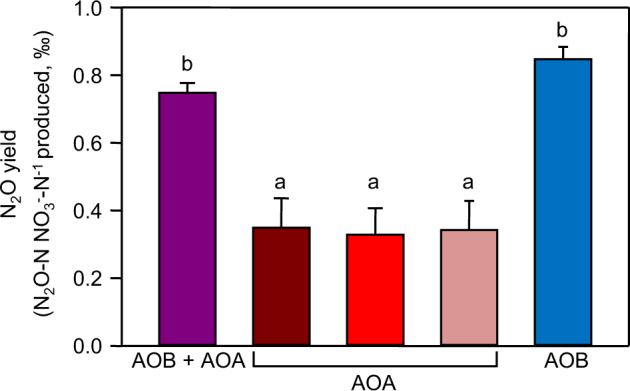
Fig. 3. The yield of N2O associated with ammonia oxidation by AOA and AOB.

N2O yield associated with activity of both AOA and AOB at high NH4+ concentration in fertilised microcosms during phase 1 (purple bar); AOA only oxidising NH3 derived from mineralisation of native organic nitrogen (dark red bar), from mineralisation of native organic nitrogen and from slowly released urea during phase 2 (medium red bar) or from mineralisation of free fertiliser-urea with inhibition of AOB by 1-octyne during phases 1 and 2 (light red bar); AOB only, calculated based on the known yield of AOA and both AOA and AOB, in addition to the observation that under conditions where both were contributing to NH3 oxidation, ~80% was performed by AOB (blue bar). Mean yields and standard errors are plotted. Significant differences are indicated by different lower case letters
