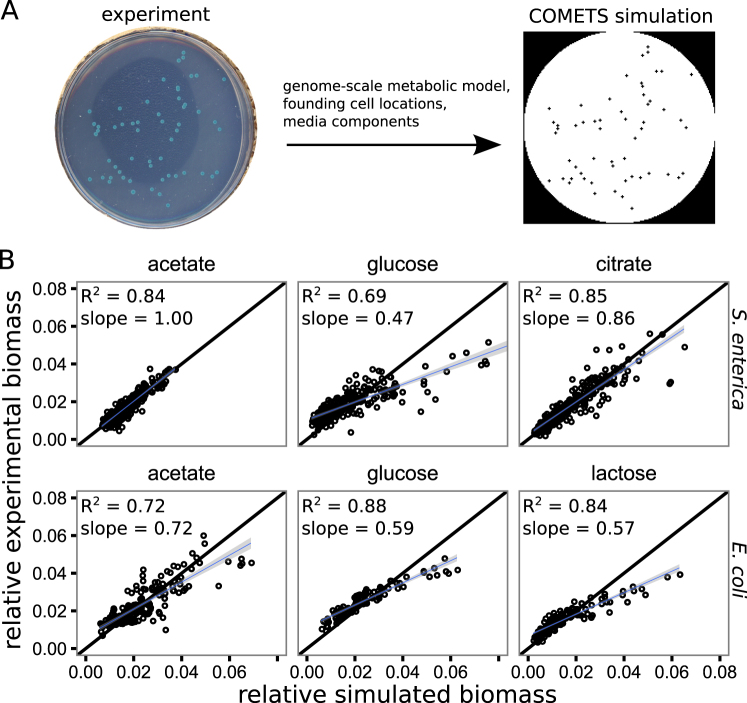
Fig. 2.
Genome-scale metabolic modeling recapitulates the variance in colony yields. a We used genome-scale metabolic modeling in the COMETS platform to test the mechanisms generating the observed variance in colony yields. The relevant genome-scale metabolic model was seeded into an environment at the sites from which colonies initiated in experiments. Dynamic flux-balance analysis calculations and subsequent metabolite and biomass diffusion were carried out in discrete time steps for a duration mimicking the laboratory experiments. b A comparison of the relative colony yields measured in experiments (y-axis) to the relative colony yields predicted by the COMETS simulations (x-axis) for the treatments accessible with COMETs (defined media, i.e., not LB). Each facet contains data from four to eight Petri dish experiments/simulations. The black line has slope = 1 and intercept = 0, while the blue lines and surrounding gray are linear regression lines with standard error. A high R2 suggests that the relative spatial effects are captured by the model, while a slope close to 1 suggests an accurate prediction of amount of variance in colony yield

