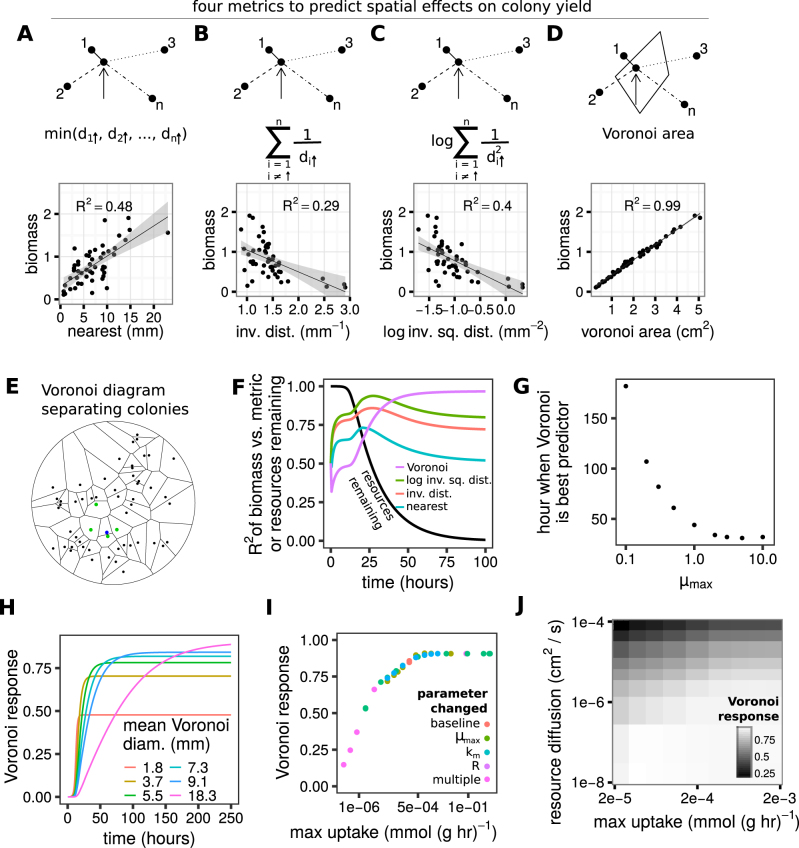
Fig. 3.
Voronoi diagrams capture the effect of location on yield better than other distance metrics. Using the simplified differential equations model, four metrics were tested to determine which colonies interact to generate variation in colony size and to what extent. a–d show a cartoon of the measurement and the metric plotted against simulated colony yield (biomass). a The distance to the closest colony, such that the yield of the focal colony (indicated by the arrow) would be predicted from the distance to colony 1, which is closest, but no other colony would be considered. b The sum of the inverse linear distances to every colony, such that the yield of the focal colony would be predicted by the distance to every colony, with each colony’s influence inversely proportional to its distance. c Like b, but colonies become quadratically less important as distance increases. d The territory closest to a colony, described by a Voronoi diagram. Here, the focal colony’s Voronoi area is shown (solid line polygon). A Voronoi diagram divides a plane into areas around colony initiation sites such that all the space in a territory is closer to its enclosed colony than to any other colony, which is accomplished by drawing perpendicular lines half-way through lines connecting a focal colony to Voronoi neighbors. e A Voronoi diagram drawn for all colony initiation sites on a Petri dish. For a focal colony (blue), its Voronoi neighbors are the green colonies. f The change in R2 over time for the different metrics vs. simulated colony biomass. The black line shows the proportion of resources left. g The hour when the R2 for Voronoi areas vs. simulated colony biomass surpasses the R2 for all other metrics, as a function of the max growth rate (μmax) used in the simulation. h The magnitude of the spatial effect (the “Voronoi response”) as a function of time. Different lines are from simulations with different average Voronoi areas, which is inversely proportional to initial cell density. i The Voronoi response as a function of the maximum potential per-mass uptake. Changes from the default (baseline) values (Supplementary Table 1) in maximum growth rate, km, starting resource concentration, or any combination of these parameters (multiple) all have similar effects j The Voronoi response is determined by the balance between the maximum uptake rate of a colony (x-axis) and the rate of resource diffusion (y-axis)

