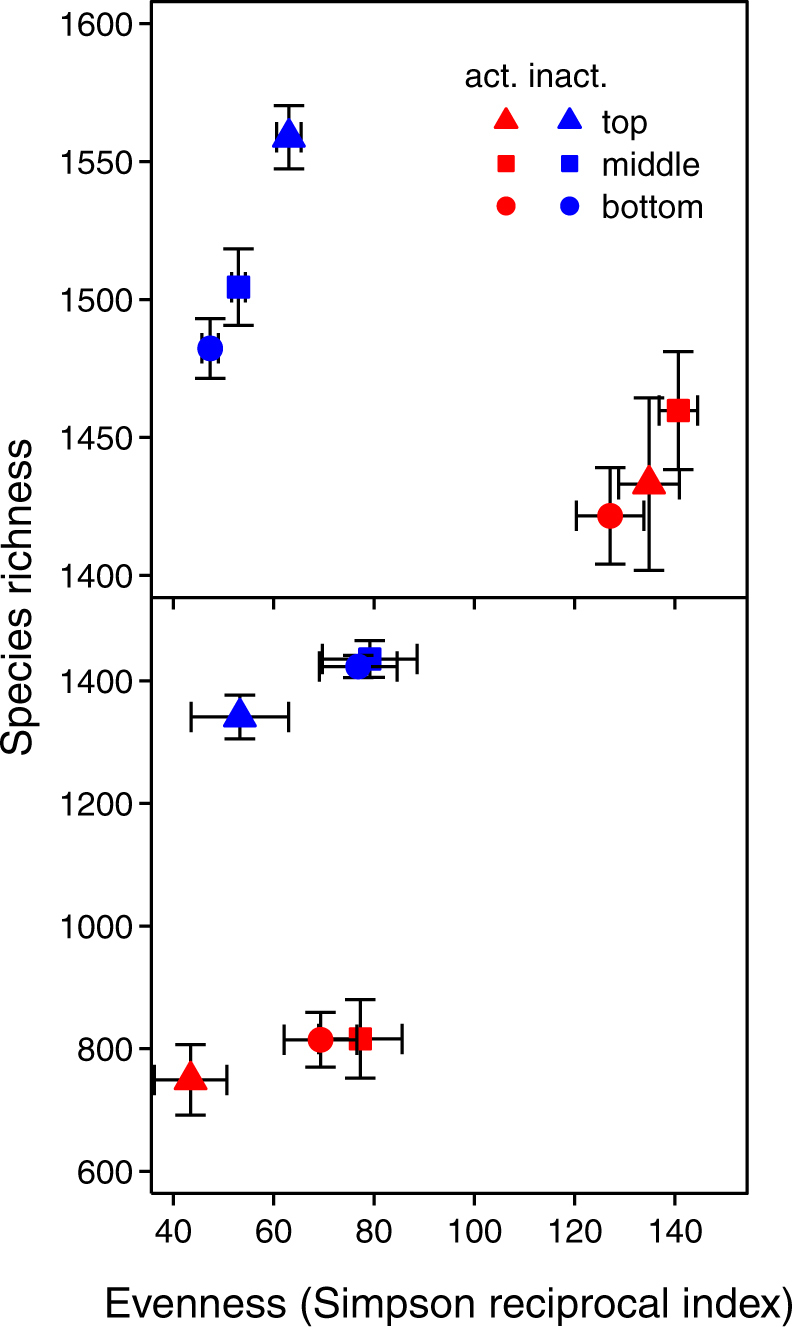
Fig. 4.

Bacterial a and fungal b observed species richness and evenness (determined by the Simpson reciprocal index) in the active (red symbols) and inactive (blue symbols) communities at three soil depths (top: 0–5 cm, triangles; middle: 10–15 cm, squares, bottom: 30–35 cm, circles). Bars indicate mean ± standard error
