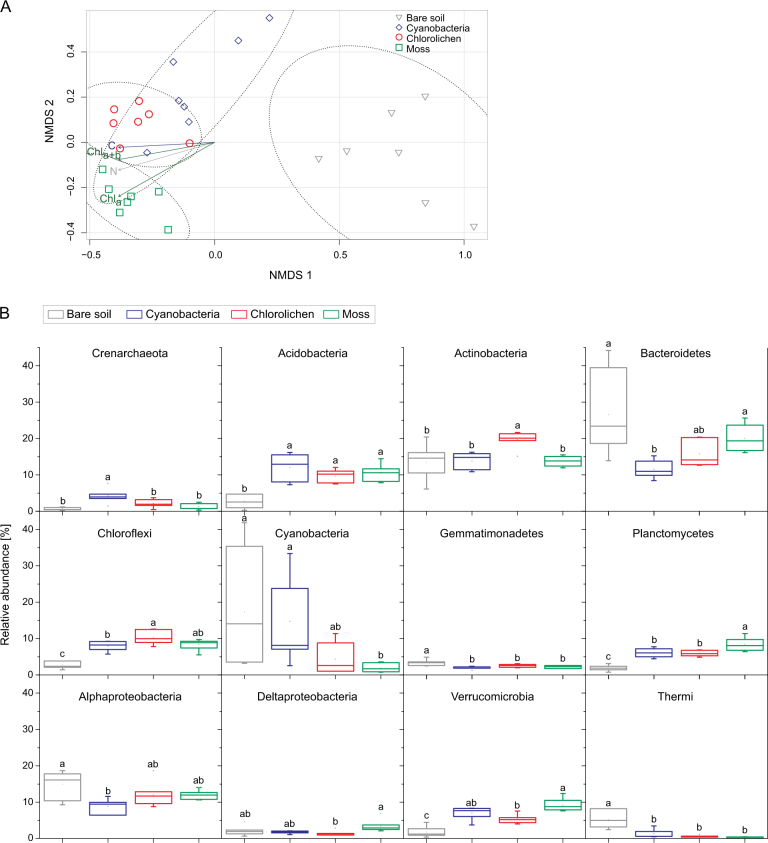
Fig. 3.
Dissimilarity of bacterial community composition in bare soil as compared to different biocrust types. Ordination using Non-Metric Multidimensional Scaling derived from Bray–Curtis dissimilarity; based on amplicon 16S rRNA gene data, rarefaction with a depth of 48 009 reads per sample; symbols coded by category. 95% confidence ellipses are shown. The function envfit from the R vegan package was used to fit environmental vectors onto the ordination (a). Relative abundance of bacterial and archaeal taxa in crust habitats and bare soil. Based on amplicon 16S rRNA gene data; rarefaction with a depth of 48 009 reads per sample. Boxes limit the 25th- and 75th percentile with the median presented as line and mean values marked as point inside. Error bars present the 1st and 99th percentile and outliers are shown as dots below and above. Significant differences (P < 0.05) are marked by different letters. n = 7 per category (b)

