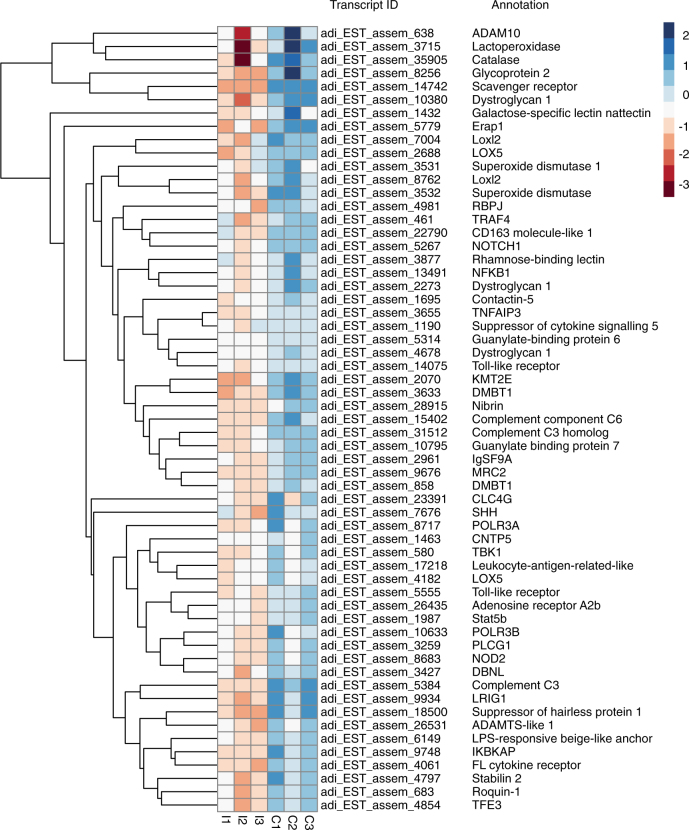
Fig. 4. Heat map of genes likely to be involved in immune, inflammatory, stress, and ROS responses in Chromera-infected (I1, I2, and I3) and uninfected control larvae (C1, C2, and C3) at 48 h post-infection.
The hierarchical clustering shown here was obtained by comparing the expression values (fragments per kilobase of transcript per million; FPKM) for Chromera-infected samples against the controls. Expression values were log2-transformed and median centered by transcript. The blue-red scale represents the relative expression values

