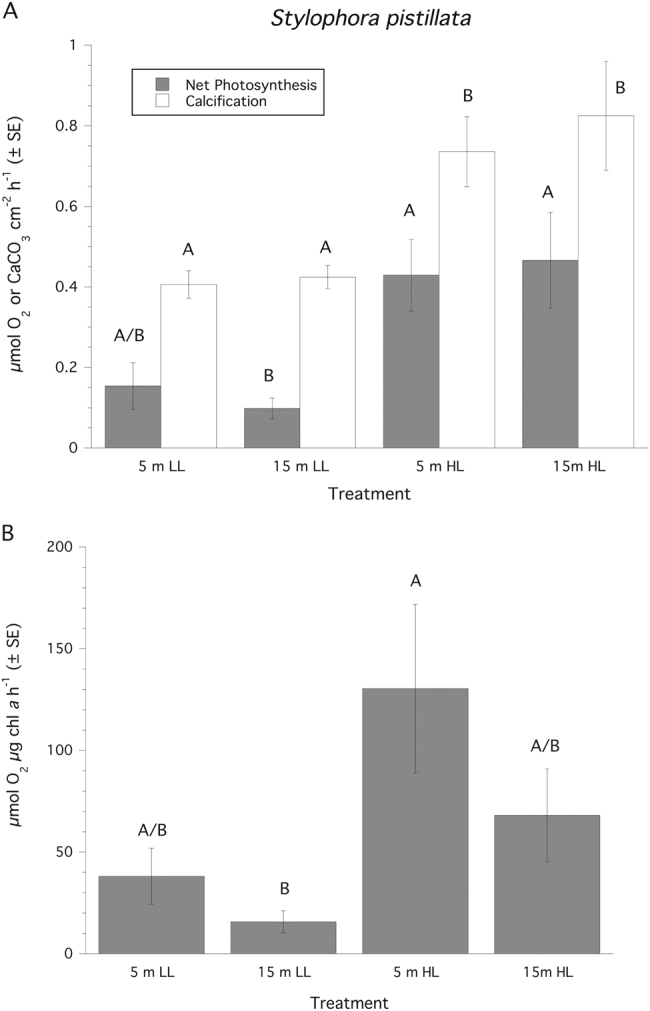
Fig. 1.

Rates of photosynthesis and calcification normalized to surface area (mean ± SE) for Stylophora pistillata. LL = 150 µmol quanta m−2 s−1, HL = 500 µmol quanta m−2 s−1. Treatment groups (n = 7 samples per group) and for each independent parameter similar superscripts are not significantly different from each other
