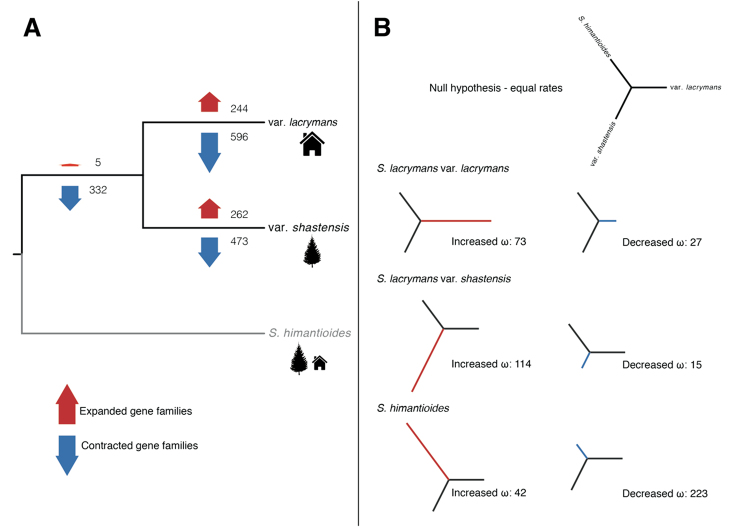
Fig. 2. The comparative genomic differences among the Serpula lacrymans var. lacrymans, Serpula lacrymans var. shastensis and Serpula himantioides.
. a The number of significantly expanded and contracted gene families, based on analyses using a birth-death model of gene family evolution on all gene clusters. The analyses use a rooted ultrametric tree from a 10 loci maximum likelihood analysis, where S. himantioides was the out-group. Thus, only changes in var. shastensis, var. lacrymans and the branch leading to these two, but not the S. himantioides branch were evaluated. b Phylogenetic sketch trees demonstrating the selection analysis. Each tree highlights a branch and the number of genes with significantly increased or decreased ω-values on that branch compared to the expected based on 5866 single gene clusters. The null hypothesis is equal rates on all branches

