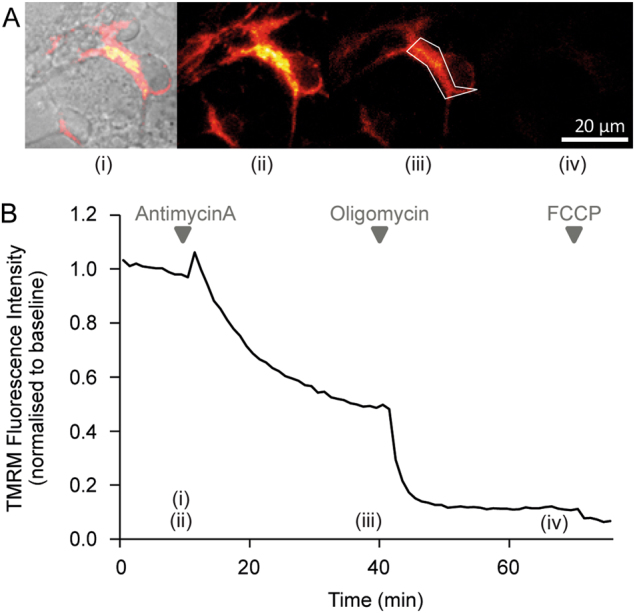
Fig. 3. Representative images and time-series data from TMRM (10 nM) measurements in wild-type mouse cortical neurons exposed to mitochondrial inhibitors.

. a Brightfield and TMRM fluorescence images were captured on a Zeiss Axiovert 100 microscope (brightfield and TMRM fluorescence are merged in the left-most image, TMRM only in the other images). b Time-series TMRM fluorescence measurements within the region of interest marked by the white polygon in (A)(ii). The precise time-points of the images in (A) are marked (i)–(iii) on the graph. Baseline fluorescence was recorded for 10 min pre-treatment and used to normalise the signal. Complex III inhibition with antimycin A (1 μM) induced a decrease in TMRM fluorescence, indicating mitochondrial membrane depolarisation. Subsequent oligomycin addition (2 μg/ml) further reduced TMRM fluorescence, indicating that prior to oligomycin addition the mitochondrial membrane potential was being maintained by the F1Fo ATP synthase operating in reverse. The loss of any remaining TMRM fluorescence after FCCP addition (10 μM) indicates mitochondrial membrane potential collapse
