
Fig. 1. Decomposing and quantifying the contribution by the resident community and the invader to shifts of niche structure.
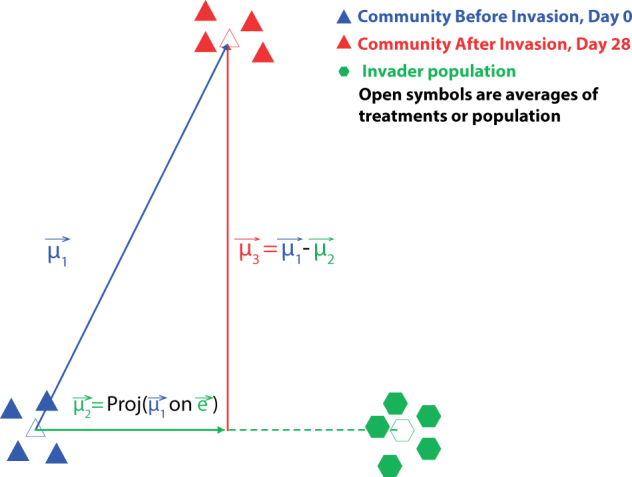
. Vector µ1 is the movement of invaded communities in resource space. Vector µ2 corresponds to the contribution of the E. coli to the invaded community’s niche shift; this vector lies along an axis, vector e, which begins at the mean of communities before invasion and extends to the niche structure of the invader population, which is shown by the dashed green line extending away from vector µ2. Vector µ3 represents the contribution of the resident taxa to the invaded community’s niche shift