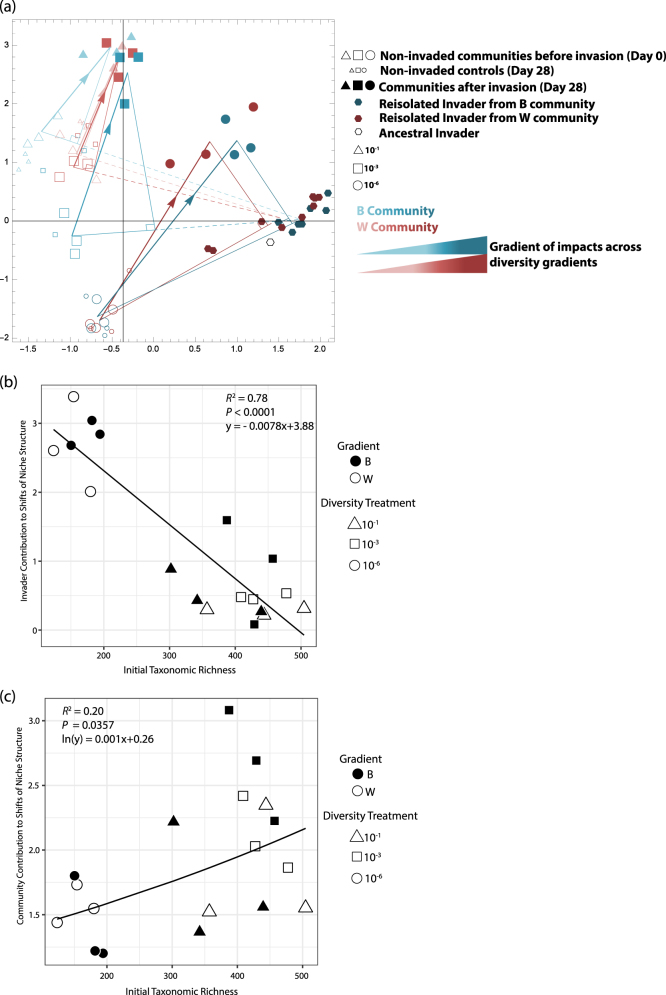
Fig. 5. Invaded communities are steered away from the invader’s niche.
. (a) is an ordination analysis visualizing the variation of the communities’ niche structures before and after invasion, and it contains vector information that teases apart the effects of the invader and of the resident taxa in regards to shifts of niche structure. Vectors with an arrow head indicate the total shift of communities upon invasion in resource space (equivalent to vector µ1 in Fig. 1). These vectors are decomposed into two orthogonal components, indicated as the legs of a right triangle. The first component of the community shift is due to the impact of the invader (solid portion of vector originating at a non-invaded community and pointing toward E. coli; this is equivalent to vector µ2 in Fig. 1); the second component reflects the response of the resident community (equivalent to vector µ3 in Fig. 1). The invader’s impact vector is continued with a dashed line merely to indicate the entire axis between non-invaded communities and the invader’s niche structure (equivalent to vector e in Fig. 1). The vectors µ2 and µ3 that were obtained separately for each treatment, are orthogonal in the 71-dimensional space of the carbon utilization profile data. Their projections onto the subspace spanned by the first two principal components (which capture 69.7% of the variation in the entire data set) are nearly orthogonal as well, implying that the dominant shifts in niche structure are consistent across treatments. The gradient of color, increasing from the most diverse to least diverse communities and terminating at the invader’s niche structure, indicates that impacts increase as diversity decreases. The least diverse, 10−6 communities are the most impacted and thus have the darkest color. (b) The vector quantifying the impact of the invader to niche shifts or (c) the vector quantifying the response and contribution of resident taxa to niche shifts are regressed with the initial OTU richness of the community

