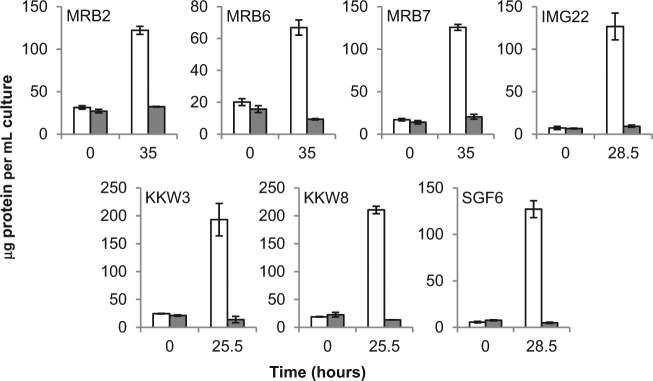
Fig. 1.
Protein concentrations of isolate cultures with (white bars) and without (grey bars) 2 mM 2AEP as the sole nitrogen source at the start of growth and at the approximate beginning of stationary phase. Y axis shows protein concentration in μg per mL culture, X axis show time in hours, isolate identifiers are shown in the top left of each subfigure. Data are averages of biological triplicates; error bars show standard error of the mean

