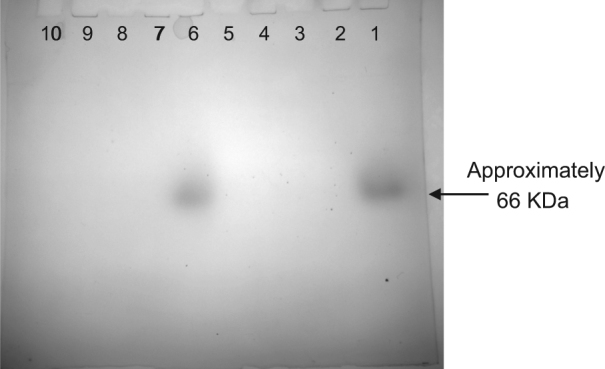
Fig. 4.

PhnA Zymogram of protein extracts from IMG22 cells exposed to different nutrient conditions. The dark spots in lanes 1 and 6 indicate phosphate release. Lane 1: cells in replete medium +2 mM 2AEP, lane 2: cells in replete medium, lane 4: -phosphorus, lane 6: 2 mM 2AEP as sole nitrogen source, lane 7: -nitrogen, lane 9: -carbon, lane 10: Novex NativeMark protein standards, lanes 3, 5 and 8: no sample
