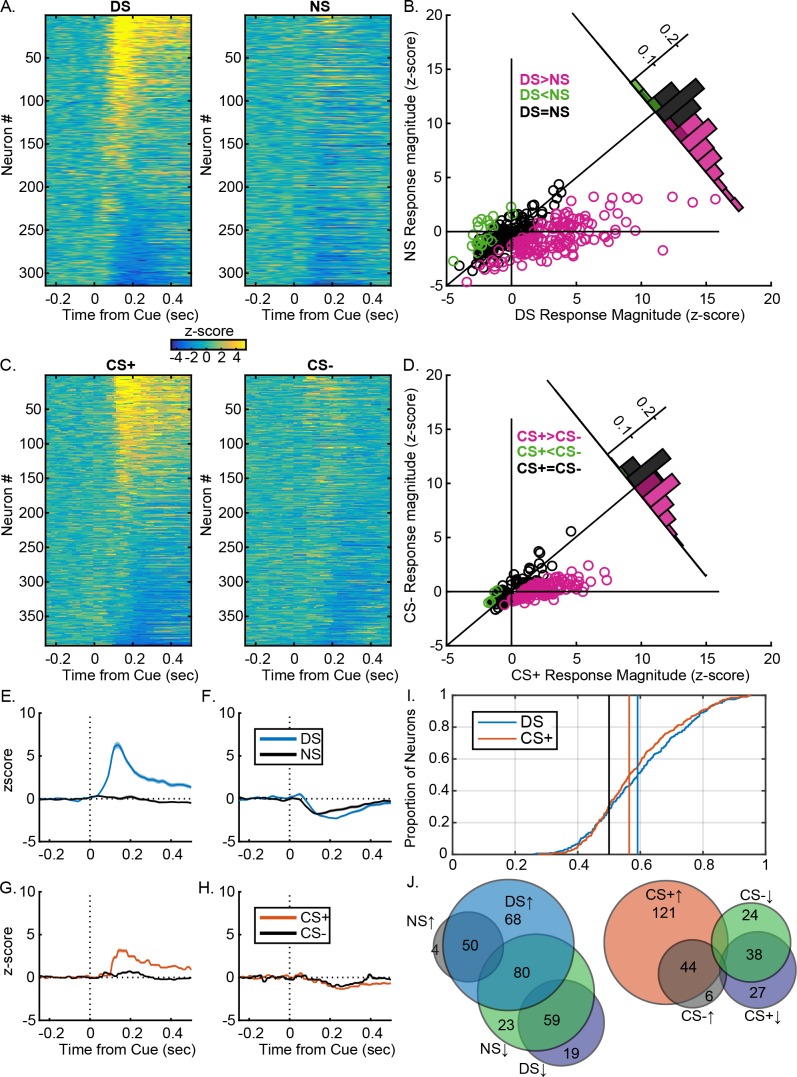
Figure 3. VP neural response are similarly predictive of the learned value of reward-related cues after instrumental or Pavlovian training.
(A) Heatmaps of responses to the DS and NS from all neurons, sorted by the magnitude and direction of their response to the DS. Each line represents the peristimulus time histogram (PSTH) of an individual neuron, normalized (z-score) and color coded. (B) Scatterplot of normalized (mean z-score) responses to the DS versus the NS, showing neurons that fire significantly more following the DS (pink), the NS (green) or neither cue (black). Inset histogram shows the distribution of units based on the difference in their normalized response to the DS versus the NS. (C) Heatmaps of responses to the CS+ and CS– from all neurons, sorted by the magnitude and direction of their response to the CS+. Each line represents the PSTH of an individual neuron, normalized (z-score) and color coded. (B) Scatterplot of normalized (mean z-score) responses to the CS+ versus the CS–, showing neurons that fire significantly more following the CS+ (pink), the CS– (green) or neither cue (black). Inset histogram shows the distribution of units based on the difference in their normalized response to the CS+ versus the CS–. Average (mean ± SEM) normalized response to the DS (blue) and NS (black) in DS excited (E) or DS inhibited (F) neurons. Average (mean ± SEM) normalized response to the CS+ (orange) and CS– (black) in CS+ excited (G) or CS+ inhibited (CS–) neurons. (I) Distribution of auROCs for the assessment of encoding of cue identity for the DS versus the NS (blue) and the CS+ versus the CS (orange). (J) Venn diagrams showing the degree of overlap between units with excitations or inhibitions to the DS and NS (left) or the CS+ and CS– (right). Numbers within each circle indicate the number of units that had a particular response pattern.

