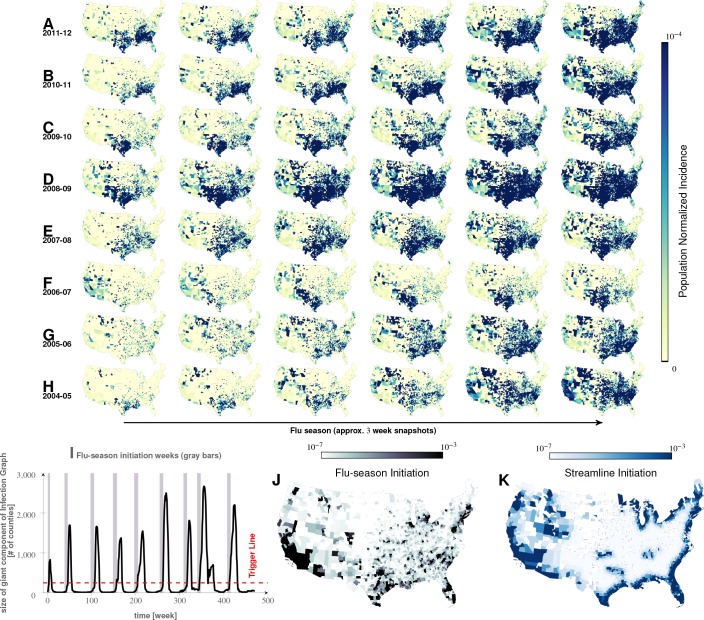
Figure 2. Characteristics of seasonal influenza in the continental US An analysis of county-specific, weekly reports on the number of influenza cases for a period of weeks spanning January 2003 to December 2013 (Plates A-H) for recurrent patterns of disease propagation.
In particular, the weeks leading up to that in which an epidemic season peaks (determined by significant infection reports from the maximum number of counties for that season) demonstrate an apparent flow of disease from south to north, which cannot be explained by population density alone (also see movie in Supplement). Plate I illustrates the near-perfect time table for a seasonal epidemic. Plates J and K compare the county-specific initiation probabilities of an influenza season, and the causality streamlines.

