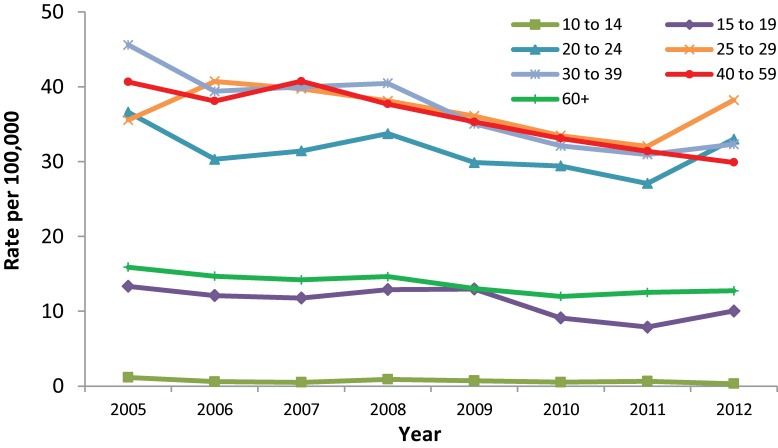
Figure 3. Rates of reported cases of Hepatitis C in females in Canada1 by age group, CNDSS2, 2005-2012.
1 Hepatitis C were not available for NU from 2007-2012 at the time of analysis. The population has been removed from the denominator for rate calculation. 2 CNDSS = Canadian Notifiable Disease Surveillance System

