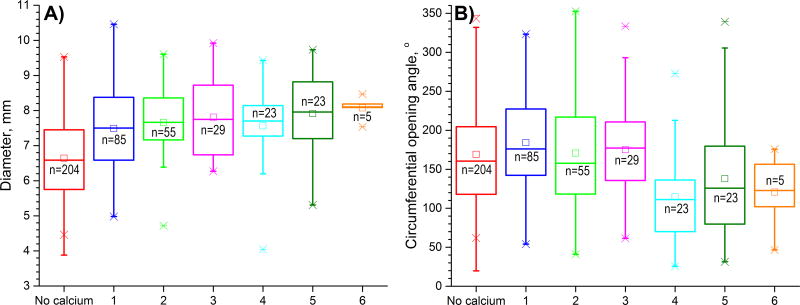
Figure 4.
A) FPA diameters (mm) and B) circumferential opening angles (°) in FPAs with different calcification burdens. Note that both diameter and circumferential opening angle are continuous variables separated into groups for better visualization. Here boxes bound 25th and 75th percentiles, whiskers extend to 5th and 95th percentiles, 99th percentile is marked with a cross (x), and maximum values are represented by a minus sign (−). Additionally, mean values are marked with a hollow square, and median is represented by a horizontal line within each box.

