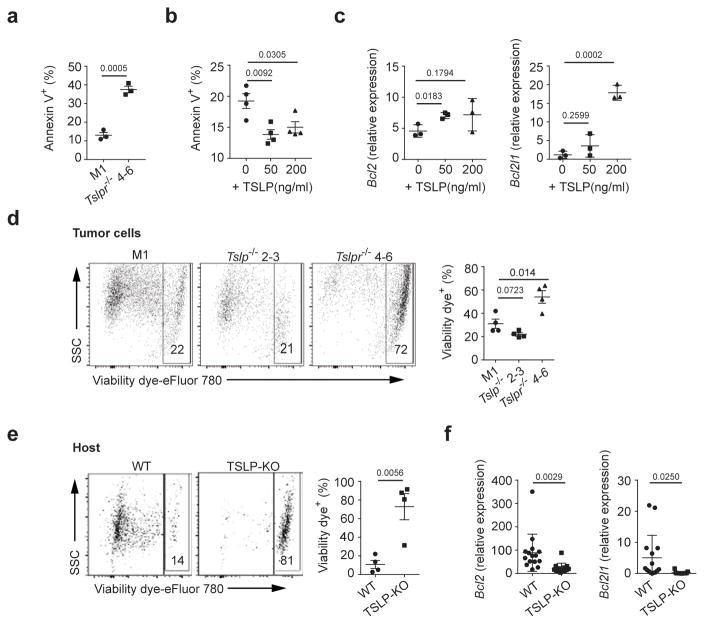
Figure 3. TSLP signaling in breast tumor cells regulates their survival and TSLP producing abilities.
Percentage of dying (Annexin V+) 4T1-Tslpr−/ − cells in vitro (a) (n=3 /group) or 4T1 cells treated with TSLP for 2 days (b) (n=4/group). (c) mRNA expression of Bcl2 and Bcl2l1, examined by qPCR, in 4T1 cells treated with TSLP. Expression values normalized to Gapdh expression. n=3/group. Representative flow plots and quantification of percentage of dying (viability dye+) 4T1-M1 vs. 4T1-Tslpr −/ − 4–6 vs. 4T1-Tslp−/ − 2–3 cells in the primary tumor in WT-tumor bearing mice (d), or dying 4T1 cells in the primary tumors from WT vs. TSLP-KO tumor-bearing mice at D28 (e). n=4/group. f, mRNA relative expression of Bcl2 and Bcl2l1 in sorted 4T1 cells from the primary tumors in (e); measurements as described for panel c. WT, n=15; TSLP-KO, n=13. Each symbol in (d right, e right, f) represents an individual mouse and in (a, b, c) represents individual cell culture. Data are represented as mean ± standard error of the mean (s.e.m.). Statistical analysis by unpaired, two-tailed t test with 95 % confidence intervals. Results in (a–d) and (e) are representative of two and three independent experiments, respectively. Results in (f) represent pooled data.

