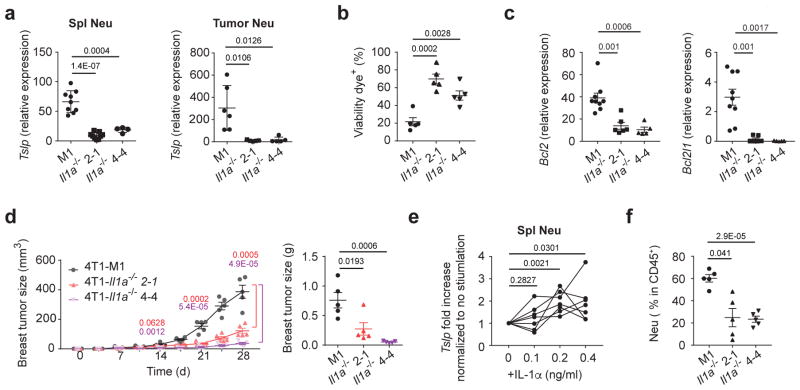
Figure 5. 4T1 derived IL-1α induces TSLP expression in neutrophils.
TSLP mRNA expression in sorted splenic neutrophils (left) (M1, n=9; Il1a−/ − 2-1, n=9, Il1a−/ − 4-4, n=4) and tumor-infiltrating neutrophils (right) (M1, n=6; Il1a−/ − 2-1, n=5, Il1a−/ − 4-4, n=5) (a), percentage of dying tumor cells in the D28 primary tumors (n=5/group) (b), Bcl2 and Bcl2l1 mRNA expression in sorted tumor cells (M1, n=9; Il1a−/ − 2-1, n=6, Il1a−/ − 4-4, n=5) (c) in the primary tumor at D28, and primary tumor progression and tumor weights (n=5/group) at D28 (d) in WT mice transplanted with 4T1-M1, 4T1-Il1α −/ − 2-1, and 4T1- Il1α −/ − 4-4 for 28 days. Expression values normalized to Gapdh expression. e, Fold increase of TSLP mRNA expression, examined by qPCR, in splenic neutrophils treated with IL-1α from D21 post 4T1 transplanted into WT mice. n=7/group. f, Percentage of neutrophils in the primary tumors (D28) of WT mice transplanted with IL-1α-KO 4T1 cells. n=5/group. Each symbol in (a, b, c, d, f) or line in (e) represents an individual mouse. Data are represented as mean ± s.e.m. Statistical analysis by unpaired, two-tailed t test with 95 % confidence intervals. Results in (a, c, e) represent pooled data and rests are representative of three independent experiments

