Figure 2.
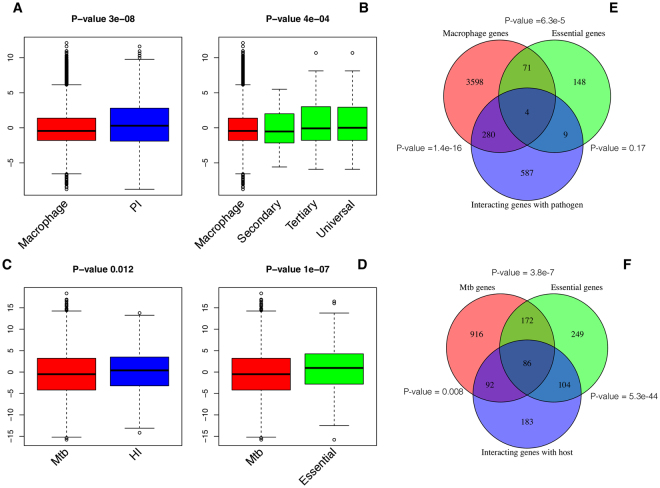
Box plots showing the comparison of differential expression Z-Scores for various gene lists with overall z-scores of the genes induced in the host-pathogen environment. The positive Z-scores indicates up-regulation, whereas negative scores indicate down-regulation; (A) Z-scores of total macrophage genes that are differentially expressed upon infection and macrophage genes predicted to be pathogen interacting (PI). (B) Z-scores of total macrophage genes that are differentially expressed upon infection and macrophage genes that were reported to be essential to regulate pathogen load using different levels of siRNA screen i.e., secondary, tertiary and universal. (C) Z-scores of total Mtb genes that are differentially expressed in infected macrophages and Mtb genes predicted to be host interacting (HI). (D) Z-scores of total Mtb genes that are differentially expressed in infected macrophages and Mtb genes reported to be essential for survival in different physiological environments. P-value calculated using Wilcoxon rank sum test shows that the distributions of each pair of comparisons are significantly different. (E) Venn-diagram with P-value of overlapping statistics between the genes that are expressed with in the macrophages, pathogen interacting and essential (tertiary screen) and (F) Venn-diagram with P-value of overlapping statistics between the Mtb genes that are expressed with in the macrophages, host interacting and essential.

