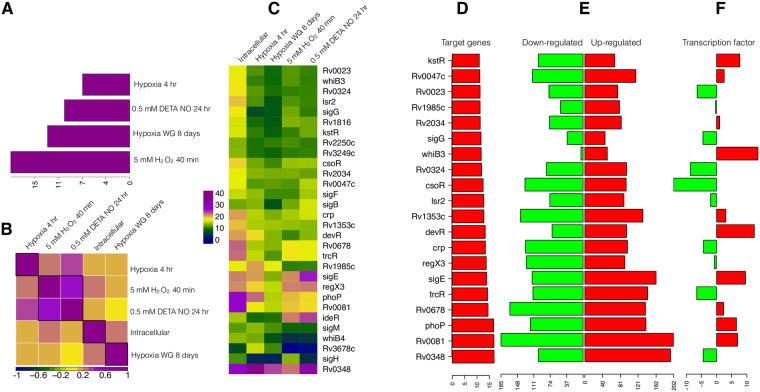
Figure 3.
Comparison of meta-analytic ranked list of Mtb genes induced in intracellular (macrophage) environment with the genes induced in-vitro conditions. (A) Bar plot showing the distribution of quantile normalized P-value of Spearman’s rank correlation (threshold value for significance is 2.3) between meta-analytic ranked list with genes induced under different hypoxia and oxidative stress conditions. (B) Correlation plot showing the Spearman’s rank correlation (all the correlations have significant P-value) between meta-analytic ranked list with genes induced under different hypoxia and oxidative stress conditions. (C) Heat map showing the over/under representation analysis scores for highly differentially expressed target genes of Mtb transcription regulators (score >2 is significant) under different conditions. (D) Bar plot showing the over/under representation analysis scores for highly differentially expressed target genes of various Mtb transcription regulators in intracellular conditions. (E) Divergent bar plot showing the number of down-regulated (green bars) and up-regulated genes (red bars) for each of the transcription regulator. (F) Bar plot showing the expression level of each of the transcription regulator.

